Steem Price Technical Analysis - The Bears Take Over, Will the Bulls Show Up Soon?
Yesterday I mentioned in my analysis "Steem Price Technical Analysis - Support Breaks Down, New Lows and What's Next for Steem" that I found three Fibonacci Clusters that could serve as important support levels. In my previous analysis I was skeptical of the first Fibonacci Cluster and was looking for a possible long entry near the second Fibonacci Cluster at the bottom of the descending channel. Well, it looks like we are approaching that level now!
Lets take a closer look at Steem and see if it's time to start scaling into a long position or if we should stay on the sidelines and wait for further confirmation.
Where are we now?
If you look below at my chart from yesterday you will notice I drew some red and green arrows forecasting the possible price directions for Steem. Please note that the green arrows forecast a increase in price while the red arrows forecast a decrease in price. These are not randomly drawn lines or guesswork, rather they are "forecasted" based on precise Fibonacci levels, price action in the descending channel, the completion of the Harmonic AB=CD pattern and Elliot Wave theory. I will discuss Elliot Wave theory in future posts. For this discussion I will focus most of my attention on Harmonics and Fibonacci levels since I am primarily a Harmonic and Fibonacci trader.
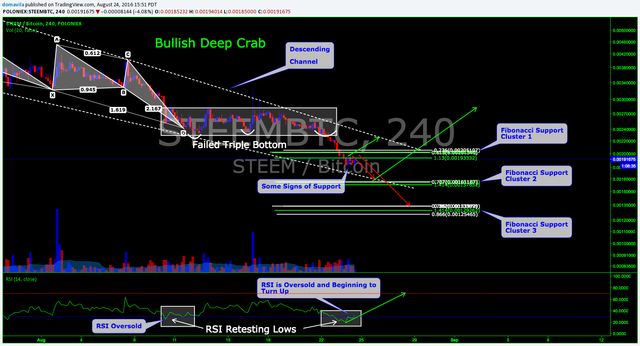
View image
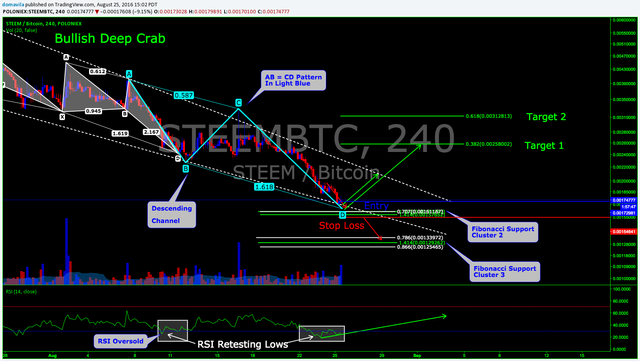
If you fast forward and look at my current chart below, you can see price followed my red arrow exactly and we are currently at the bottom of the descending channel nearing our second Fibonacci cluster. This is also where the symmetrical AB=CD pattern completes and is the exact area I predicted price would fall to yesterday and where I would consider to start scaling into a long position . This example clearly illustrates the predictive power of Harmonics and Fibonacci levels.
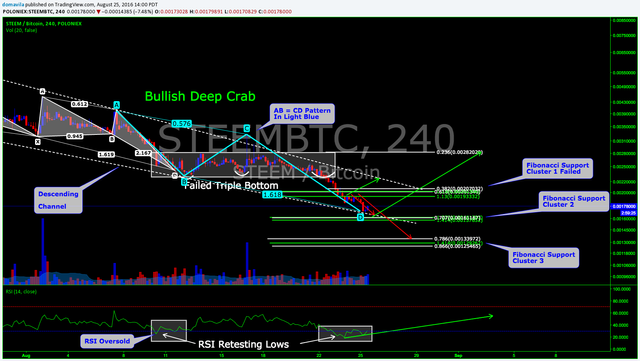
View Image
Now that we reached our target what do we do next? Do we open a long position or wait? Lets look at "A Case for the Bulls" and "A Case for the Bears" and see.
Case for the Bulls
Even though we have been in a descending channel for several weeks and the price of Steem has plummeted significantly there are several cases to consider in favor of taking out a long position.
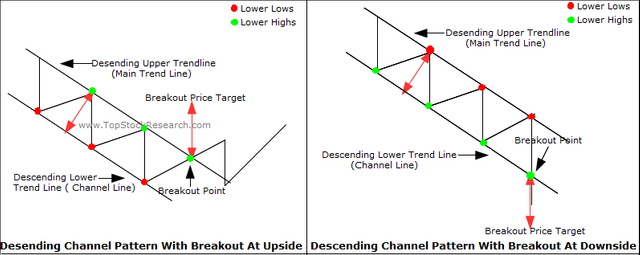
The Descending Channel
Price has finally reached the bottom trend line of the descending channel. This trend line is a nice support level and we could see price price bounce to the upside off this trendline.Fibonacci Support
As mentioned earlier, price reached our second Fibonacci Support Cluster and here we can expect price to stall and possibly reverse.The AB=CD Harmonic Pattern
The AB=CD pattern has completed at the 1.618 extension. This is a key Fibonacci level and usually where markets tend to reverse. The 1.272 extension is another key reversal level but we have already passed that.
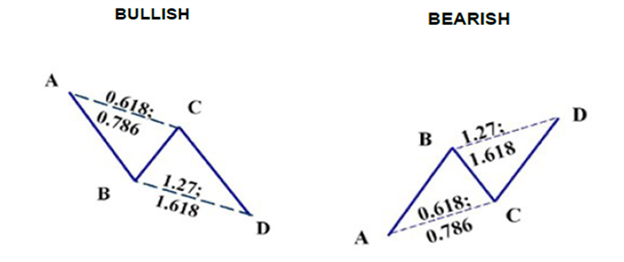
Below is Scott Carney's definition of the AB=CD harmonic pattern.
The AB=CD pattern™, is a price structure where each price leg is equivalent.
The Fibonacci numbers in the pattern must occur at specific points. In an ideal AB=CD pattern™, the C point must retrace to either a 0.618 or 0.786. This retracement sets up the BC projection that should converge at the completion of the AB=CD and be either a 1.27 or 1.618. It is important to note that a .618 retracement at the C point will result in a 1.618 BC projection. A .786 retracement at the C point will result in a 1.27 projection.
The most important consideration to remember is that the BC projection should converge closely with the completion of the AB=CD.
These examples provide some "cases" to go long but before we hit that "buy" button lets take a look at the "Case for the Bears".
Case for the Bears
The Descending Channel
Although we used the descending channel as support to go long we will use it as a case to go short as well. As a bear we should wait for support in the descending channel to break down and wait for trend line to be violated. In this case out next downside target will be the Fibonacci Support Cluster 3.
The 50 and 100 MA's
Steem continues to trade below the 50 MA and the 200 MA. This is bearish.Lower Lows and Lower Highs
The Bears have been successful in printing "lower lows" and "lower highs". This is one of the main signs of bearish price action and until we start printing "higher highs' Steem looks bearish.
RSI
RSI is oversold at 27.6.
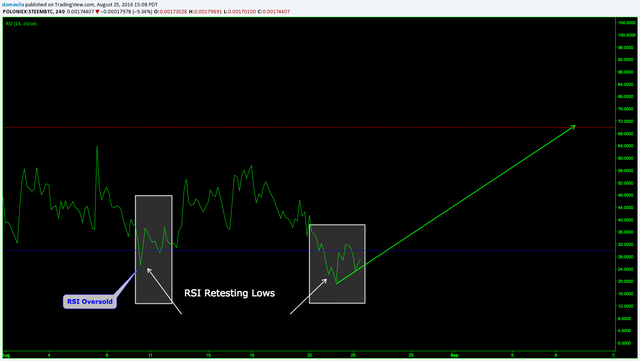
View Image
After a secondary retest of the lows RSI is beginning to turn up and provides us with a nice trigger to go long
once it breaks to the upside.
The Trade
After reviewing the above cases, I have decided to go with the Steem Bulls and will begin to cautiously scale into a long position with a tight stop loss. The trade setup will be based off the AB=CD harmonic pattern. Target 1 will be the 0.382 Fibonacci retracement of the AD leg and Target 2 will be the 0.618 retracement of the AD leg. More conservative traders can use the 0.382 retracement and 0.618 of the CD leg. Whichever route you choose remember to remain consistent and disciplined. Consistency and adherence to the trade plan are of the utmost importance to the trader and the only way to measure ones trading system. If you use the AD leg as your retracement stick with it and vice versa.
Please note that the top of the descending channel (follow the short green arrow) is a soft target for me. If I see price struggle breaking out of the descending channel I will consider scaling out of my trade and take profit here.
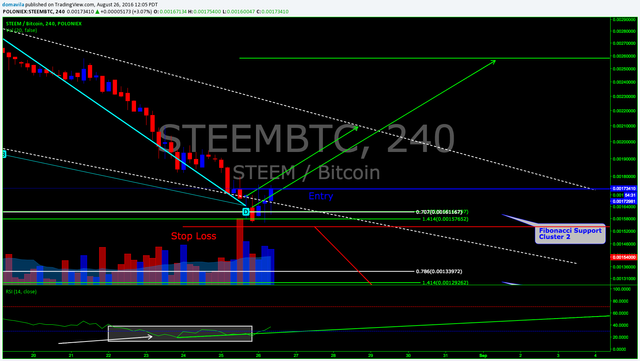
As can be seen on the chart below, I placed my stop loss (red line) below the Fibonacci Support Cluster 2 and my entry is defined by the blue line. The entry was a limit buy order at 0.0173 and I will continue to scale into my long position if price moves in the right direction.
In order to set up this trade I erased the Fibonacci Support Cluster 1 from my chart since it is no longer relevant and I got rid of some other drawings to clean up the chart. I have drawn the Fibonacci targets, stop loss and entry and we now have clean set up based on the AD=CD harmonic pattern. Please follow this live trade here to watch it play out in real time.
View Image
Position
Entry: 0.00173 BTC
Stop Loss: 0.00154 BTC
Target 1: 0.00258 BTC
Target 2: 0.00312 BTC
Soft Target: 0.0021 BTC
I am long on Steem Power because I have a mission

https://steemit.com/introduceyourself/@steempowerwhale/i-am-steempowerwhale-and-i-am-here-to-upvote-your-lifetime-dreams
Nice brotha!
I need to do a lot of reading & demo stuff until I can completely understand the logic behind your analysis, but so far it seems clear enough even for a total newbie like myself.
Still, I think I'll pass on playing on the market till the point when I understand what I am doing.
I really appreciate it. Harmonic trading and Fibonacci analysis seems difficult at first and I try to make it as simplistic as possible. I'm glad that someone who is not familiar with it understands my analysis. Check out my links to harmonic trading or Scott carney above. He is the inventor and master of harmonic trading.
Also, it is very wise of you to sit out until you gain a deeper understanding. When you do jump in only trade small amounts at first and slowly build up.
As always feel free to ask any questions.
Thing is, I understand that trading is more of an art then precise science, and I've been doing a lot of stuff like that, and it is all about looking for several factors that point toward the same probability, and I see a lot of that in your analysis.
Exactly!!
Good luck with your trade. It can get scary out there...
I came pretty close to getting stopped out @nxtblg but we are currently witnessing a small bounce.
View Image
Trading should never be scary, if it is then you are risking too much. Every time I enter a trade I am completely prepared for either outcome, wether it be winning or loosing. That being said, winning always feels a lot better than loosing.
Take it easy brotha.
@domavila, great analysis as always. You are a braver soul than me. I'm waiting for .0012, then I will start buying some.
Counter trend trading can be quite risky and that's why I am slowly scaling in with a tight stop loss. Your 0.012 target is right in the area of my third Fibonacci price cluster.
If price falls that far I will be looking to open a lager position.
As always great analysis and I liked the way you introduced the theory too - saved me hitting up Google Search to remind me of the ABCD Fibonacci parameters.
Right on Carrinm. I take a lot of extra time posting links to everything I mention so the readers have a quick reference and don't have to take the time to look it up . I'm glad it was of use to you and thanks for commenting as always. When I get home I'll check out your page and see what you have charted out.
once again a great TA update!
Right on ozmaster!! I'm about to check out what you posted today.
This stuff still blows my mind. I find myself asking why it works like it does. But, this is excellent analysis and even though most of it goes over my head, I always enjoy the read. Thank you for being an awesome Steemian!
Wow. Thanks a lot man, your comment made my day. If you have any questions please ask. I will help out as much as possible.
UPDATE
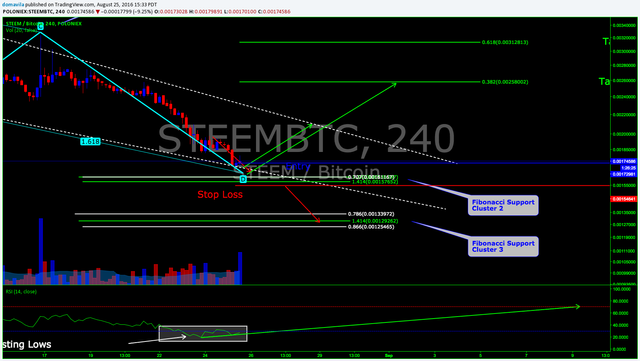
Please note that I forgot to mention that if support fails we can expect to see price fall further into the Fibonacci Support Cluster 3 on my chart. If that occurs I will be looking at this area to reopen a long position.
View Image
I would like to take the time to thank everyone for commenting and liking my analysis. I really appreciate it! If you have any questions or opinions on this pair, trading or anything please comment.
UPDATE 2
View Image
Unfortunately I was stopped out on this one. We are now looking at support near the 0.00125- 0.00127 BTC level. Also, the descending channel has broke to the downside. This looks extremely Bearish.