Steem chart review, June 13th 2018 @ 12:30 PST

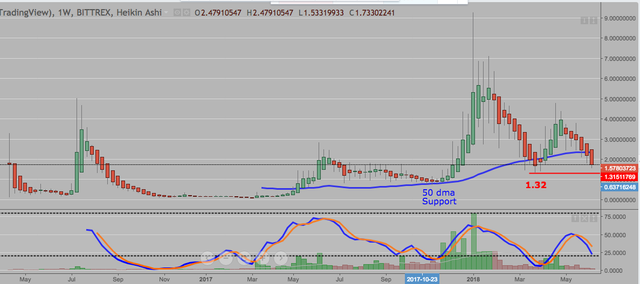
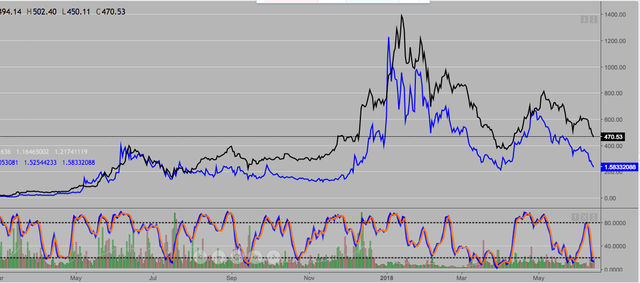
Here is the weekly of Steem going back to the start in April 2016.
- It is easy to spot the uptrends and downtrends with the green/red bars of the heikin ashi overlay.
- There are currently 6 red bars illustrating the downtrend over the past 2 months. (With no sign of a reversal)
- The 50 dma in blue provided support in late 2017, but price has recently pierced through to the downside with no support.
- The previous low produced in ~April 2018 of 1.32 may be the next support level. (?)
- Stochastics are on the downtrend and close to the oversold 20 level.
Overall (obvious) trend is down...
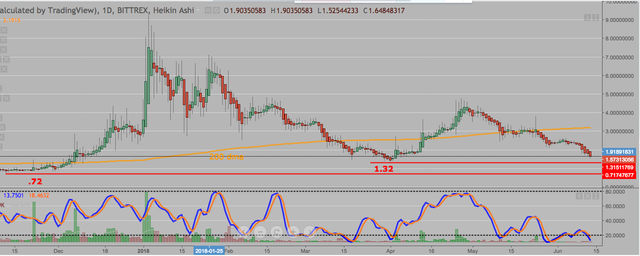
This is the daily chart from the Bittrex exchange.
- There has been a lot of red heikin ashi bars than green since the end of April.
- Price is below the 200 dma. (bearish)
- Stochastics are under 20 and oversold. 3 full days below 20 and it be embedded. (If so, there is a downside bias)
- The 1.32 may be support, but if broken the next support level may be the .72 low back in November 17.
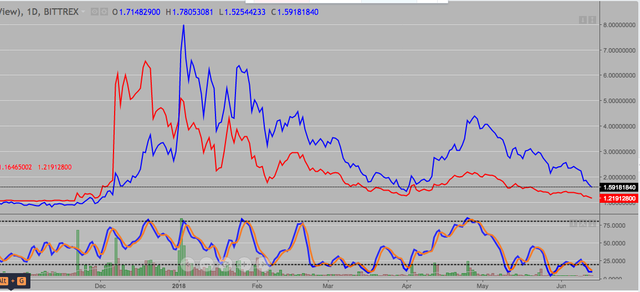
This is a line chart comparing Steem in Blue to SBD's in Red. There was a tight correlation up to November last year.
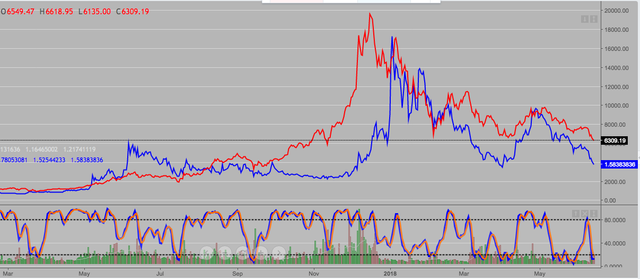
The line chart of Steem in Blue compared to Bitcoin in Red. BTC has a huge influence over most of the 'alt' cryptos and you can see it in the charts.
The line chart of Steem in Blue compared to Ethereum. I think that Steem trades closer to ETH than to BTC.
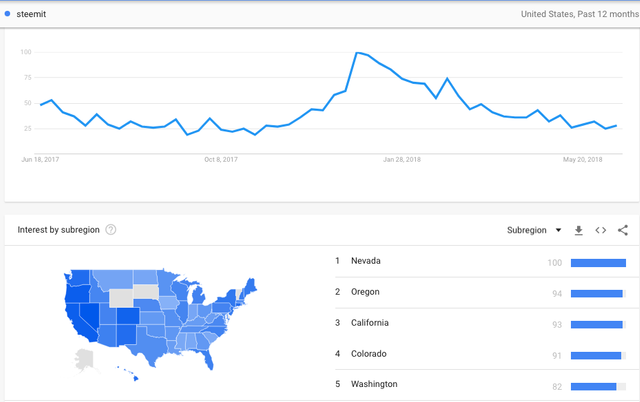
Google trends for the search for Steemit within the United States. The 'gambling' state of Nevada holds the # 1 spot. Isn't that appropriate...
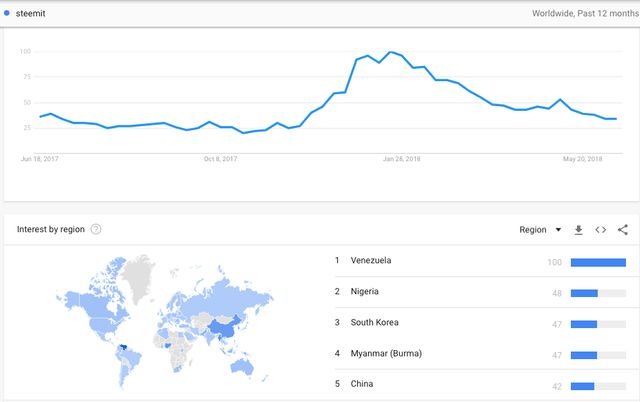
Google trends for the search for Steemit shows Venezuela in the # 1 spot. Over the past few months, I have occasionally made my way to the 'introduce yourself' section and have notice that many of the new posts were from Venezuela.
With the whole crypto market in a downtrend with no near term end in sight, there will be a eventual bottom to this cycle and potential buying opportunities. (Like Steem to increase your SP!)
Keep your eye on the BTC chart to see the direction of this sector...
If you check the daily chart of STEEM/BTC it does not look so bad. It is the huge correlation with Bitcoin that makes it look that bad.
Last Sunday downtrend probably automatically released a bunch of stop orders and that created an even stronger downtrend but my feeling is we are reaching the end of the downtrend. Still, have to wait to see.
I think BTC has a bit more to drop, maybe a double bottom with the early February low? So I expect lower Steem prices as well, at least for the near term.
The situation is alarming because value is going down and down. I hope for better future that it will move up. Sir You have elaborated well.
excelente post @glennolua
Coins mentioned in post:
You got a 2.63% upvote from @postpromoter courtesy of @glennolua!
Want to promote your posts too? Check out the Steem Bot Tracker website for more info. If you would like to support the development of @postpromoter and the bot tracker please vote for @yabapmatt for witness!
You got a 4.98% upvote from @upme thanks to @glennolua! Send at least 3 SBD or 3 STEEM to get upvote for next round. Delegate STEEM POWER and start earning 100% daily payouts ( no commission ).