STEEM possible moves and price zones
for the reason I have repeated several times (like this last time), I look in to STEEMETH and alternatively STEEMBTC for analyzing the STEEM price.
briefly because the crypto atmosphere seems to get mature comparing to years ago, and you can breathe and live in there! and the BTC or ETH as the leading coins lead the market totally, so the changes to these two pairs, can be more informative than comparing with fiats like USD.
ok, let's check the chart:
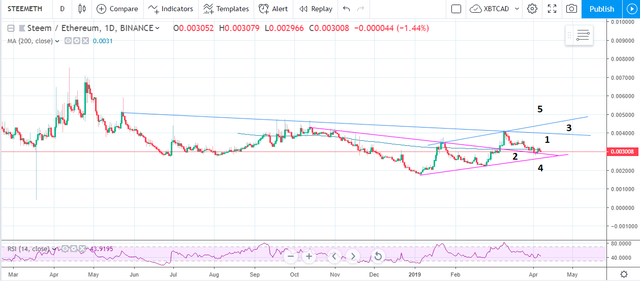
Zone 1: the last resistance level which performed as a support and didn't let the price drop below 0.0029
if it drops below, it will enter Zone 2, to test the 0.0027 support level.
if the price stays in the Zone 1, it will test the res. level 0.0039 to check if it can get in to the Zone 3
Obviously above the Zone 3 we will start a strong uptrend in to Zone 5 and below Zone 2, we will go bearish in to Zone 4.
So, what is important and special about these levels?
or, what is not obvious and should be extracted from these info?
here it is:
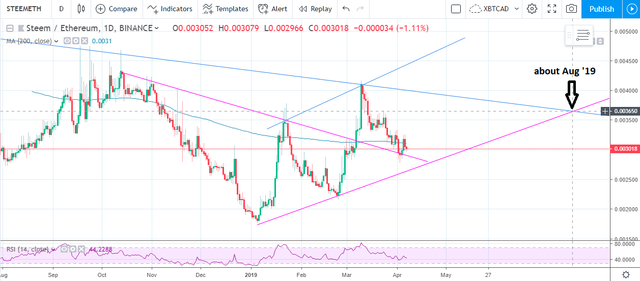
The mostly probable scenario is the price goes side in the Zone 1, till the two support and resistance levels contradict, and then a decision will be made. if you check the level 0.00365, you will see it has acted critically in March and January this year, and even back in 2018, months like June, July, Feb and March.
So don't miss the coming months, monitoring the pair ;)
According to your chart I genuinely believe we will head towards zone 3 after retest, Steem is so underbought it's insanity. It is one of the best buys still even after doubling in price the last few months. $1 isn't far off for us at all.
there are issues which have resulted in this situation 🤐