Trade Alerts and Updates, Steem and Top 3 Cryptos (BTC, ETH, XRP) -- February 13, 2018 -- WARNING, BEARISH PATTERNS SPOTTED!

Hello Crypto Investors!
The crypto market has rebounded nicely over the last several days. However, I don't think the market is out of the woods yet. I noted in my previous post that I had a neutral stance on the markets short term. The markets have pretty much gone sideways so I was correct.
-Short term over the next few days, I have a slightly bearish stance on the crypto market. It has recovered nicely but they are trading at areas of resistance now, and these charts are forming bearish consolidation patterns, except for Ripple.
-Long term several months out, I am bullish on cryptos. I think the crypto market overall is oversold in the grand scheme.
Right click the charts then open in new tab to get a zoomed in view
Steem/USD (Bittrex)
Previous Post (February 10)
Daily Chart


"Steemit is forming a triangle pattern. It hit resistance at $4.80 near the moving average crossover. This will continue to be an area of resistance, along with the red trendline. I think $2.75 and then the 200 MA will be good support areas. After that, the next major area of support will be $0.90-1.00."
Today's Update
Daily Chart
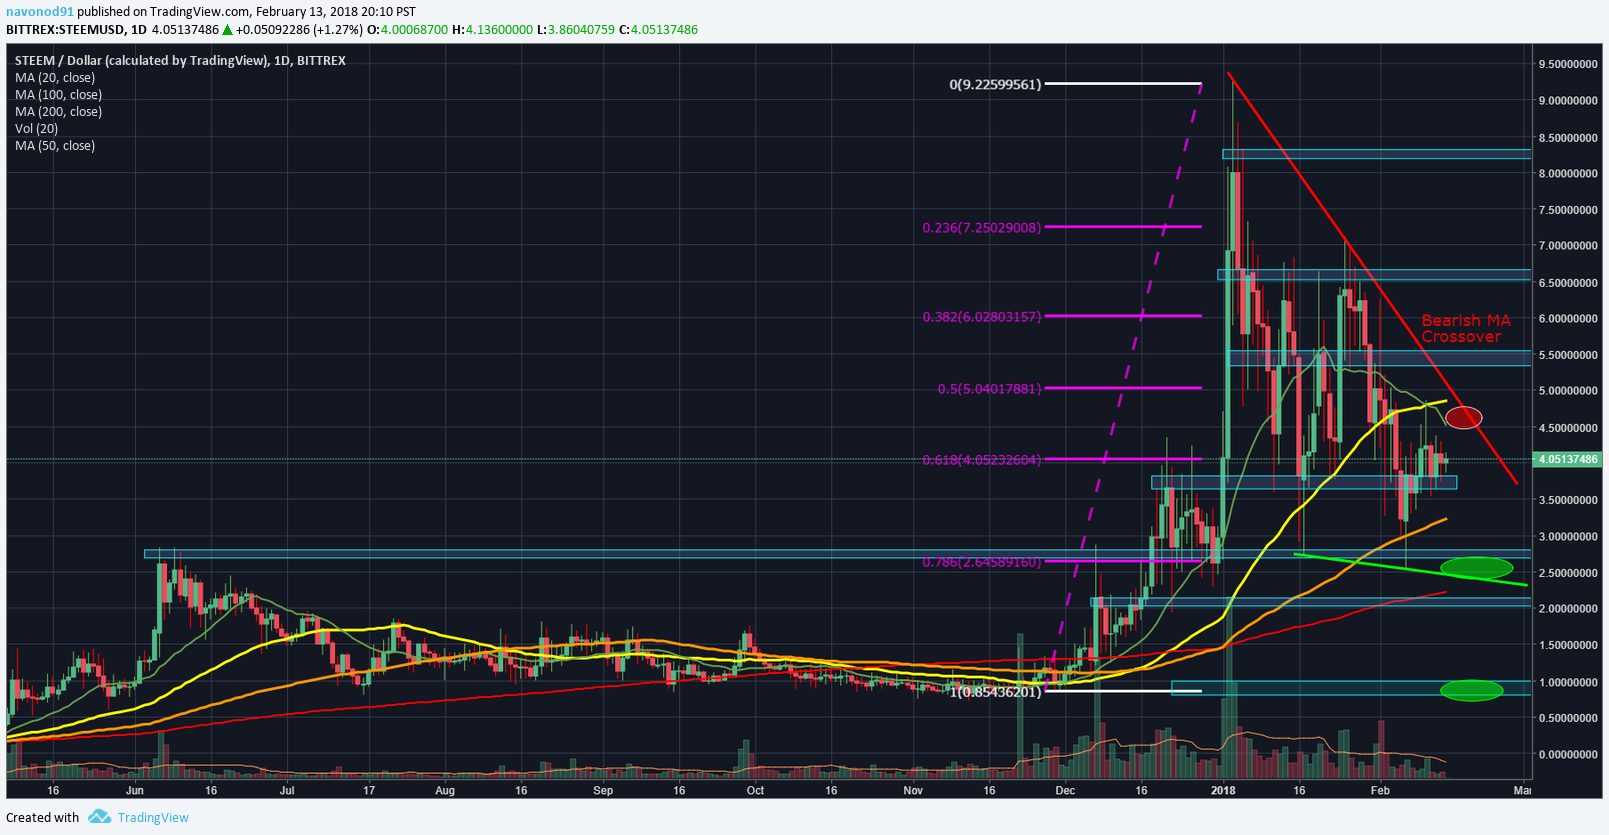
Steem has formed a bear flag pattern and it recently had a bearish MA crossover of the 20 MA and 50 MA. This chart looks bearish.
Buy at $2.40 - $2.70.
Sell at $4.50 - $4.75.
BTC/USDT (Bittrex)
Previous Post (February 10)
Daily Chart
"BTC hit resistance at 9000 based on the new trendline. It either needs to consolidate then break through the red trendline, or it will break down and fall back down to 6500 or possibly even 5000."
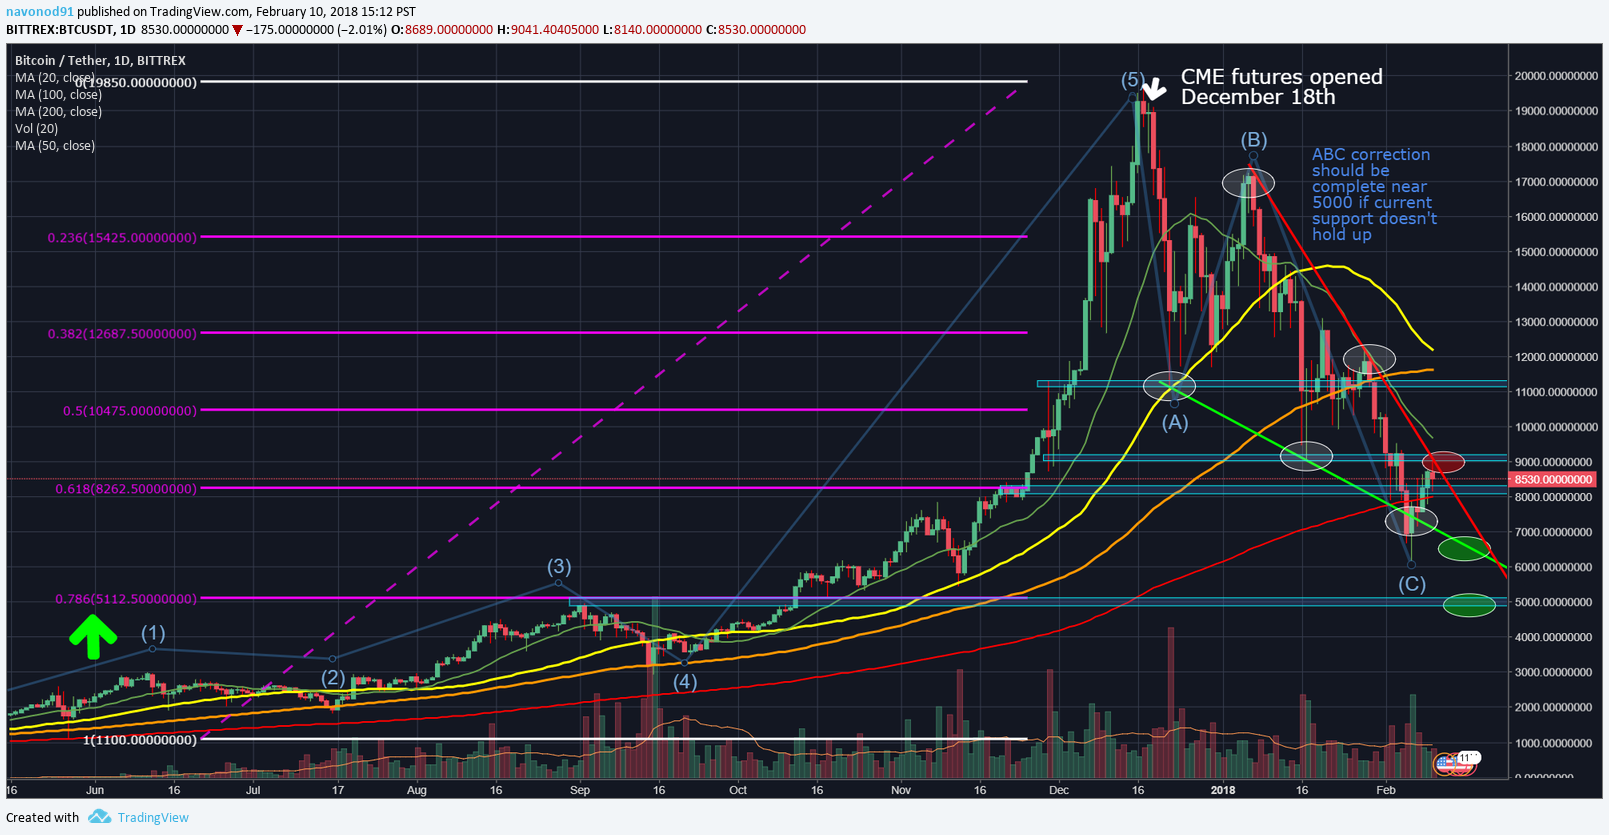
Today's Update
Daily Chart

BTC is forming a bearish flag pattern that started on February 6th. I also don't like how the 20 day MA is trading just above the current price.
Buy at 6000-6200.
Sell at 20 day MA.
ETH/USDT (Bittrex)
Previous Post (February 10)
Daily Chart
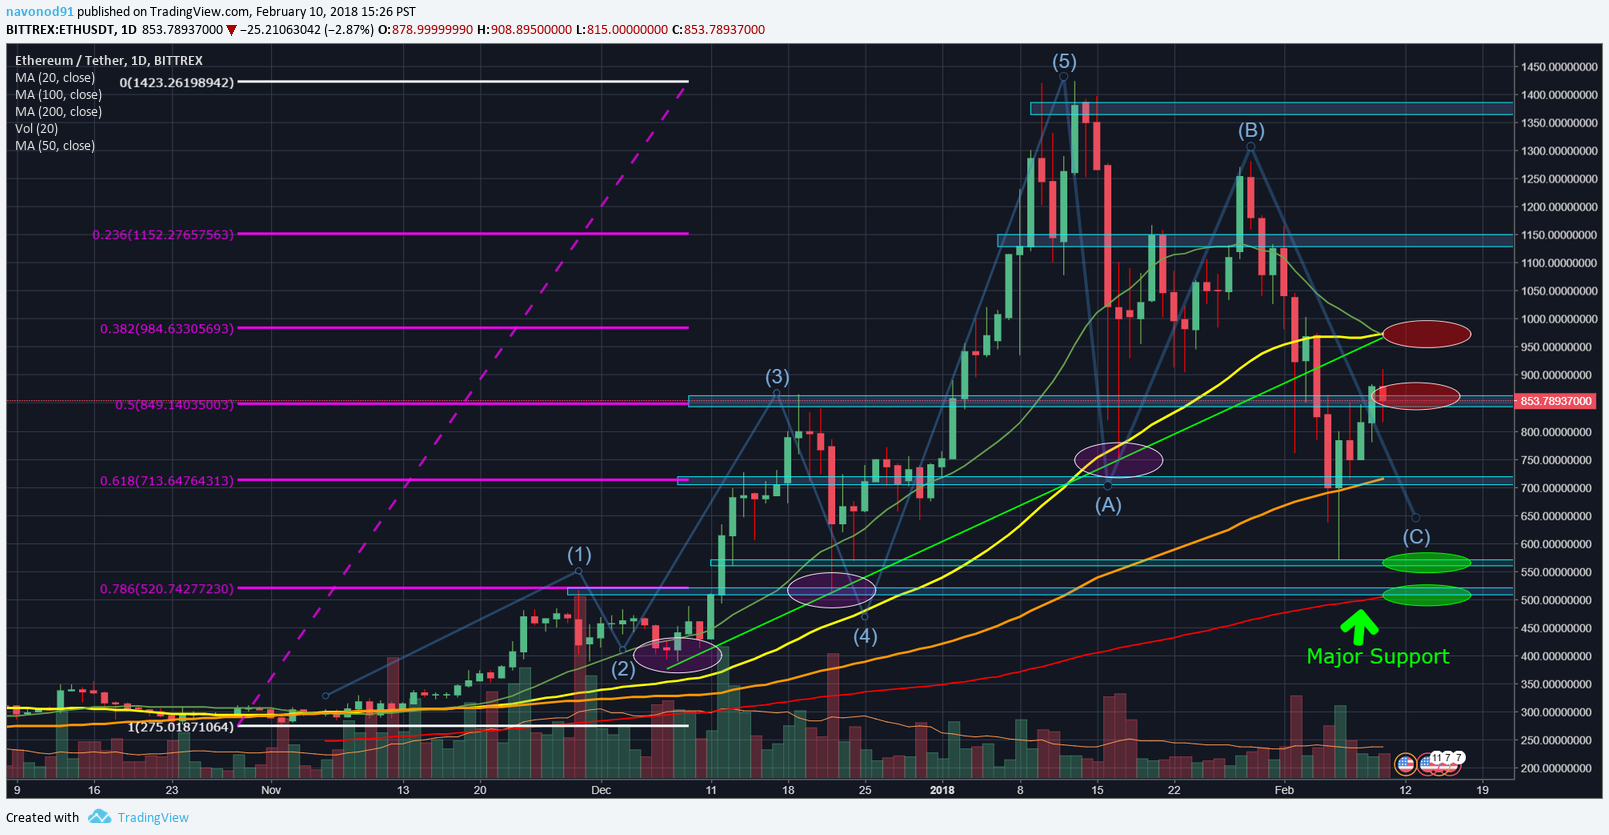
"Buy at 575 and 500. Sell at 850 and 975."
Today's Update
Daily Chart
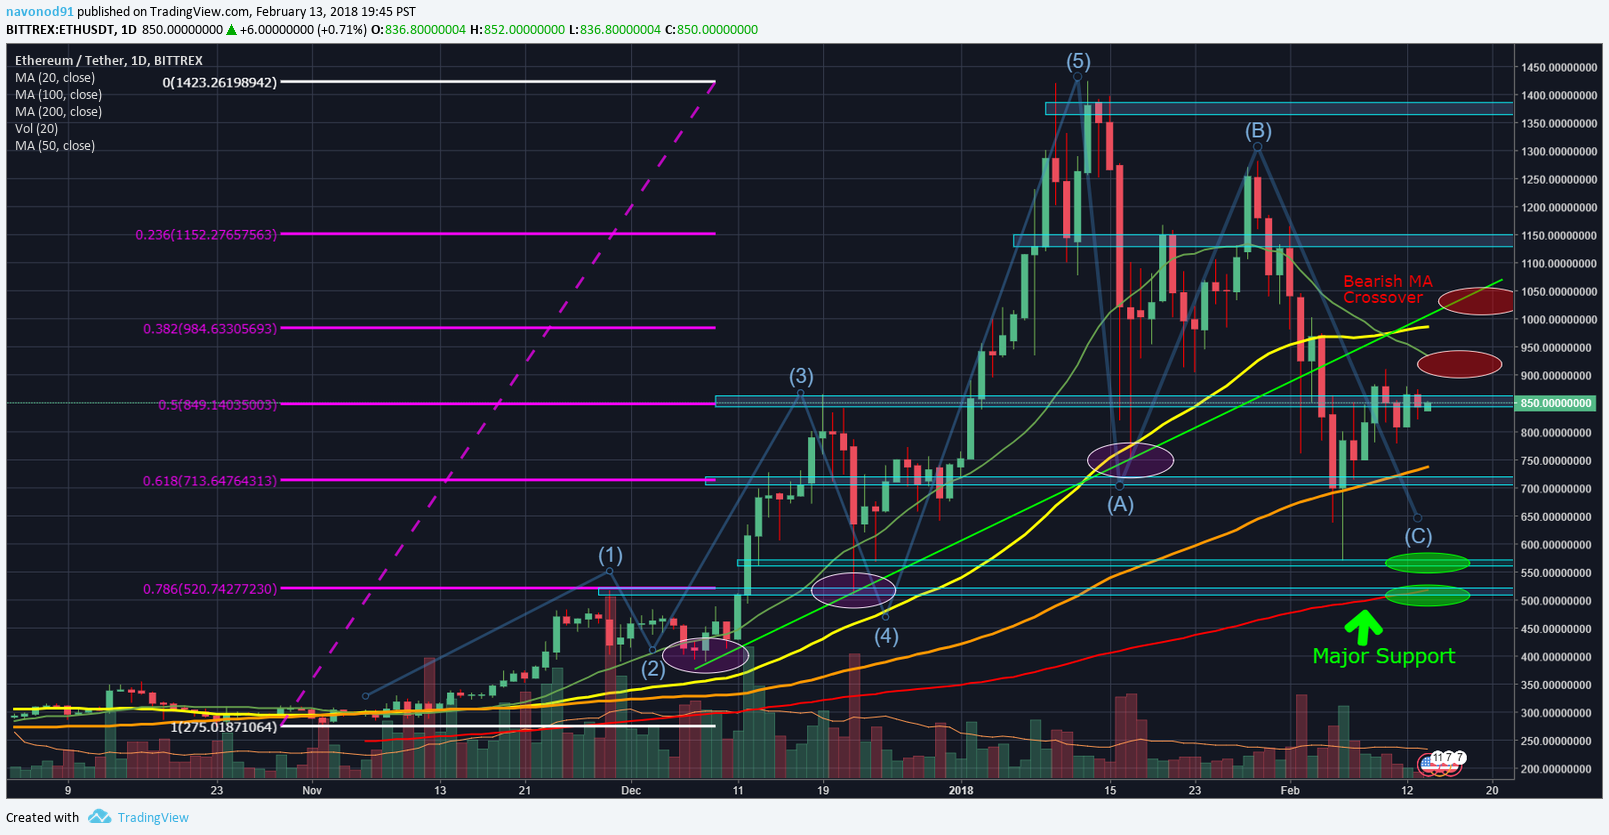
Another bear flag pattern coupled by a bearish MA crossover. This chart looks bearish as well.
Buy at 575-600 and 500-520.
Sell at 875-900.
XRP/USDT (Bittrex)
Previous Post (February 10)
Daily Chart
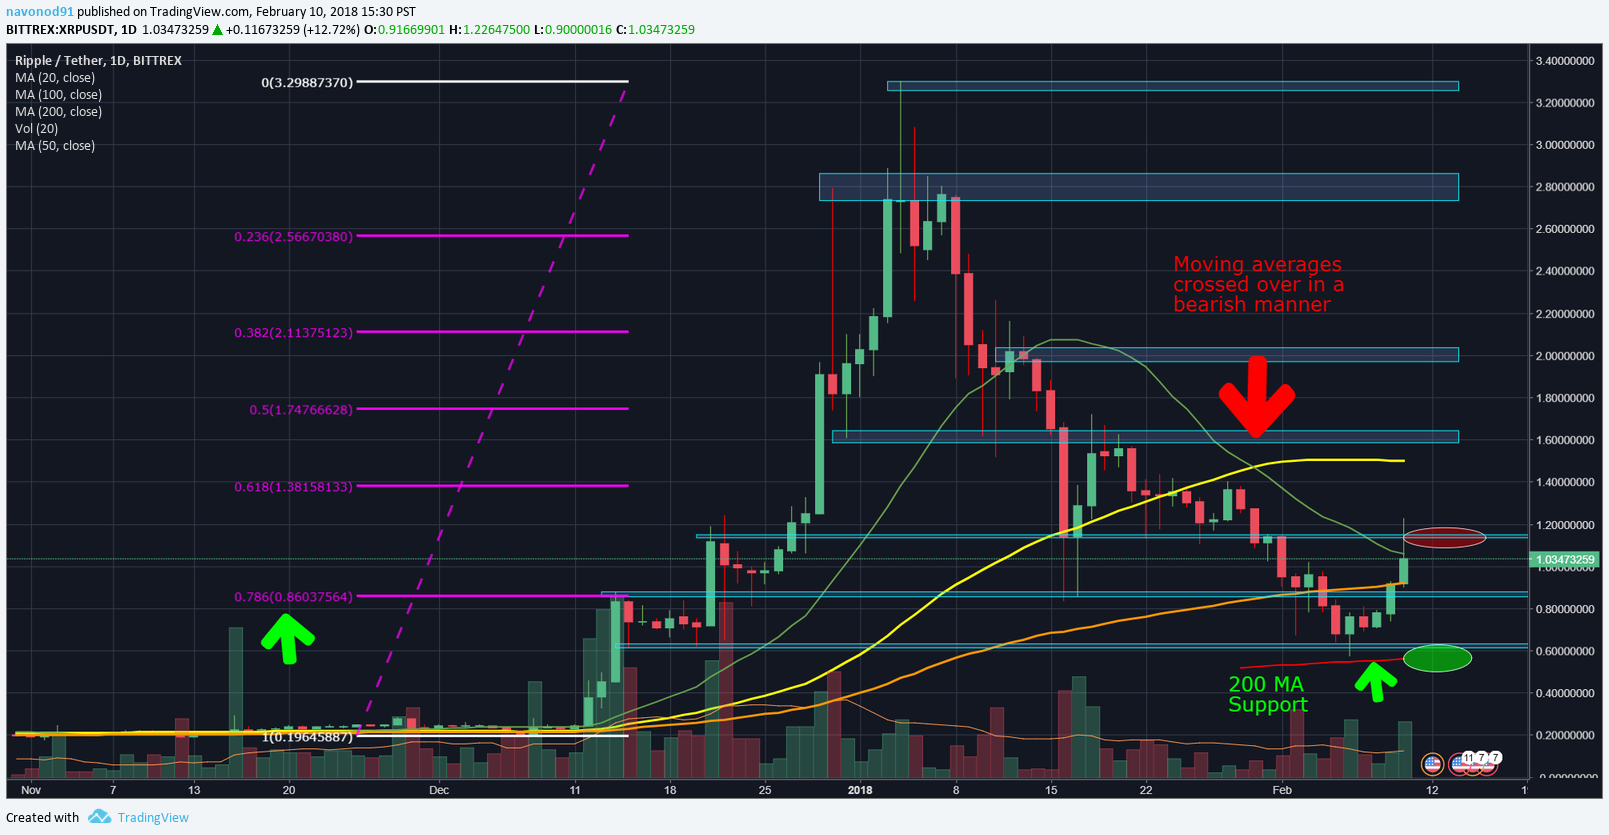
"Same as previous post. Buy at the 200 MA, which is about 0.55 USDT. Sell at 1.15 USDT. Notice how XRP sold off once it started trading at 1.20, just above my sell area. I also said 0.55 would be major support, and it bottomed at 0.574 then doubled in price."
Today's Update
Daily Chart
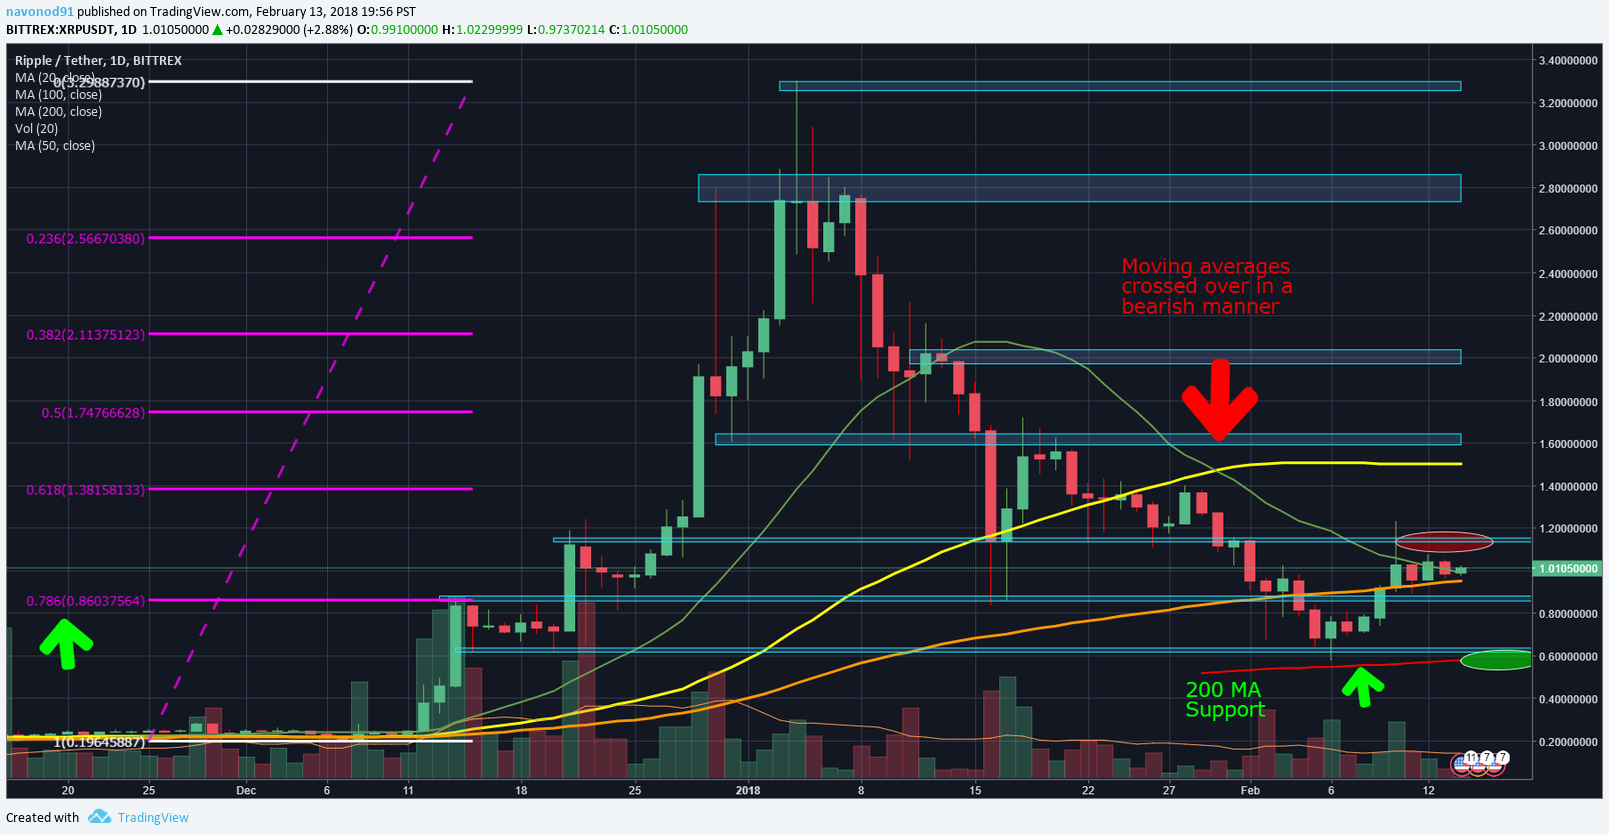
Out of the 4 charts in this post, this one looks the least bearish. It actually seems to be forming a small bull flag since February 10th. However, because the other 3 charts look bearish, I am not a fan of XRP right now.
Buy at 0.55-0.60
Sell at 1.15-1.20

I provide frequent updates on cryptos and US stocks along with occasional updates on forex and futures. I use fundamental and technical analysis to dictate where markets go. I use the following signals for technical analysis:
Fibonacci Retracements -- Simple Moving Averages -- Trendlines -- Candlestick Patterns -- Elliot Waves -- Horizontal Support and Resistance -- Volume --
Disclamer:
I am not a financial adviser nor is this professional financial advice. These are just my opinions and you should do your own due diligence before making any investments.
Congratulations @tricksofthetrade! You received a personal award!
Click here to view your Board
Congratulations @tricksofthetrade! You received a personal award!
You can view your badges on your Steem Board and compare to others on the Steem Ranking
Vote for @Steemitboard as a witness to get one more award and increased upvotes!