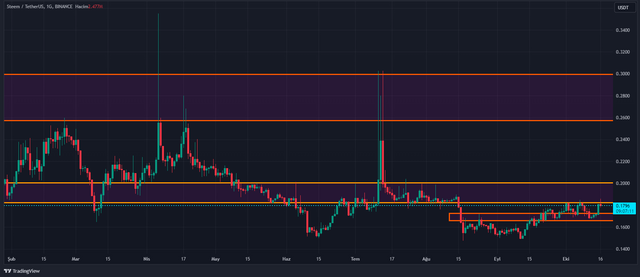
My Current Steem Chart
Hello again. I haven't been around for a long time. I hope that from now on I will continue to produce content and discover new content on a permanent basis.
Before I start creating content, I should point out that; I follow the Steem price regularly. And most of the time I trade. Many of the drawings I made were from months ago. However, today I will share the daily chart. Data is from Binance exchange. I took the screenshot from Tradingview site.

Below there is a supply-demand zone passing through the 0.176-0.172 price range. Above, there is a psychological resistance in the $0.18-0.20 price range. If this supply-demand zone can be broken, we can expect a price increase in Steem.
I am not an investment advisor. It would be more beneficial if you view this post as an educational exercise. You should make your investment decisions based on your psychological state and financial situation. See you later.