JSXGraph - Dynamic Mathematics with JavaScript
JSXGraph
Dynamic Mathematics with JavaScript
Screenshots
Hunter's comment
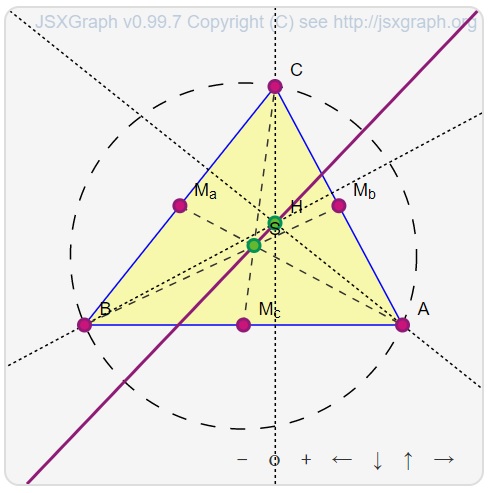
JSXGraph is a cross-browser JavaScript library for interactive geometry, function plotting, charting, and data visualization in the web browser.
Whether you would like to create simple charts, or complex geometric shapes and graphs, or visualize your data in an interactive way this JSXGraph can help you with that.
It utilized web technologies like SVG and canvas to render your graphs on a web page or app. Once you get familiar with it and how it makes the complex simple and turns boring to interesting, I am sure it may become your favorite plotting tool.
It is an open-source library, doesn't require any dependencies, and delivers optimized performance. Feel free to visit the product link to learn more about its awesome features and what it can offer as a plotting tool for interactive charts and visualization. On the website, you will find many interesting examples that demonstrate the power of JSXGraph and what you can achieve with it.
Link

This is posted on Steemhunt - A place where you can dig products and earn STEEM.
View on Steemhunt.com
Please read our posting guidelines.
Connect with Steemhunt
It is a great figure... perfect
Posted using Partiko Android
Congratulations!
We have upvoted your post for your contribution within our community.
Thanks again and look forward to seeing your next hunt!
Want to chat? Join us on:
This looks neat
Posted using Partiko Android