Steem Dollar: technical analysis of 4 February 2018
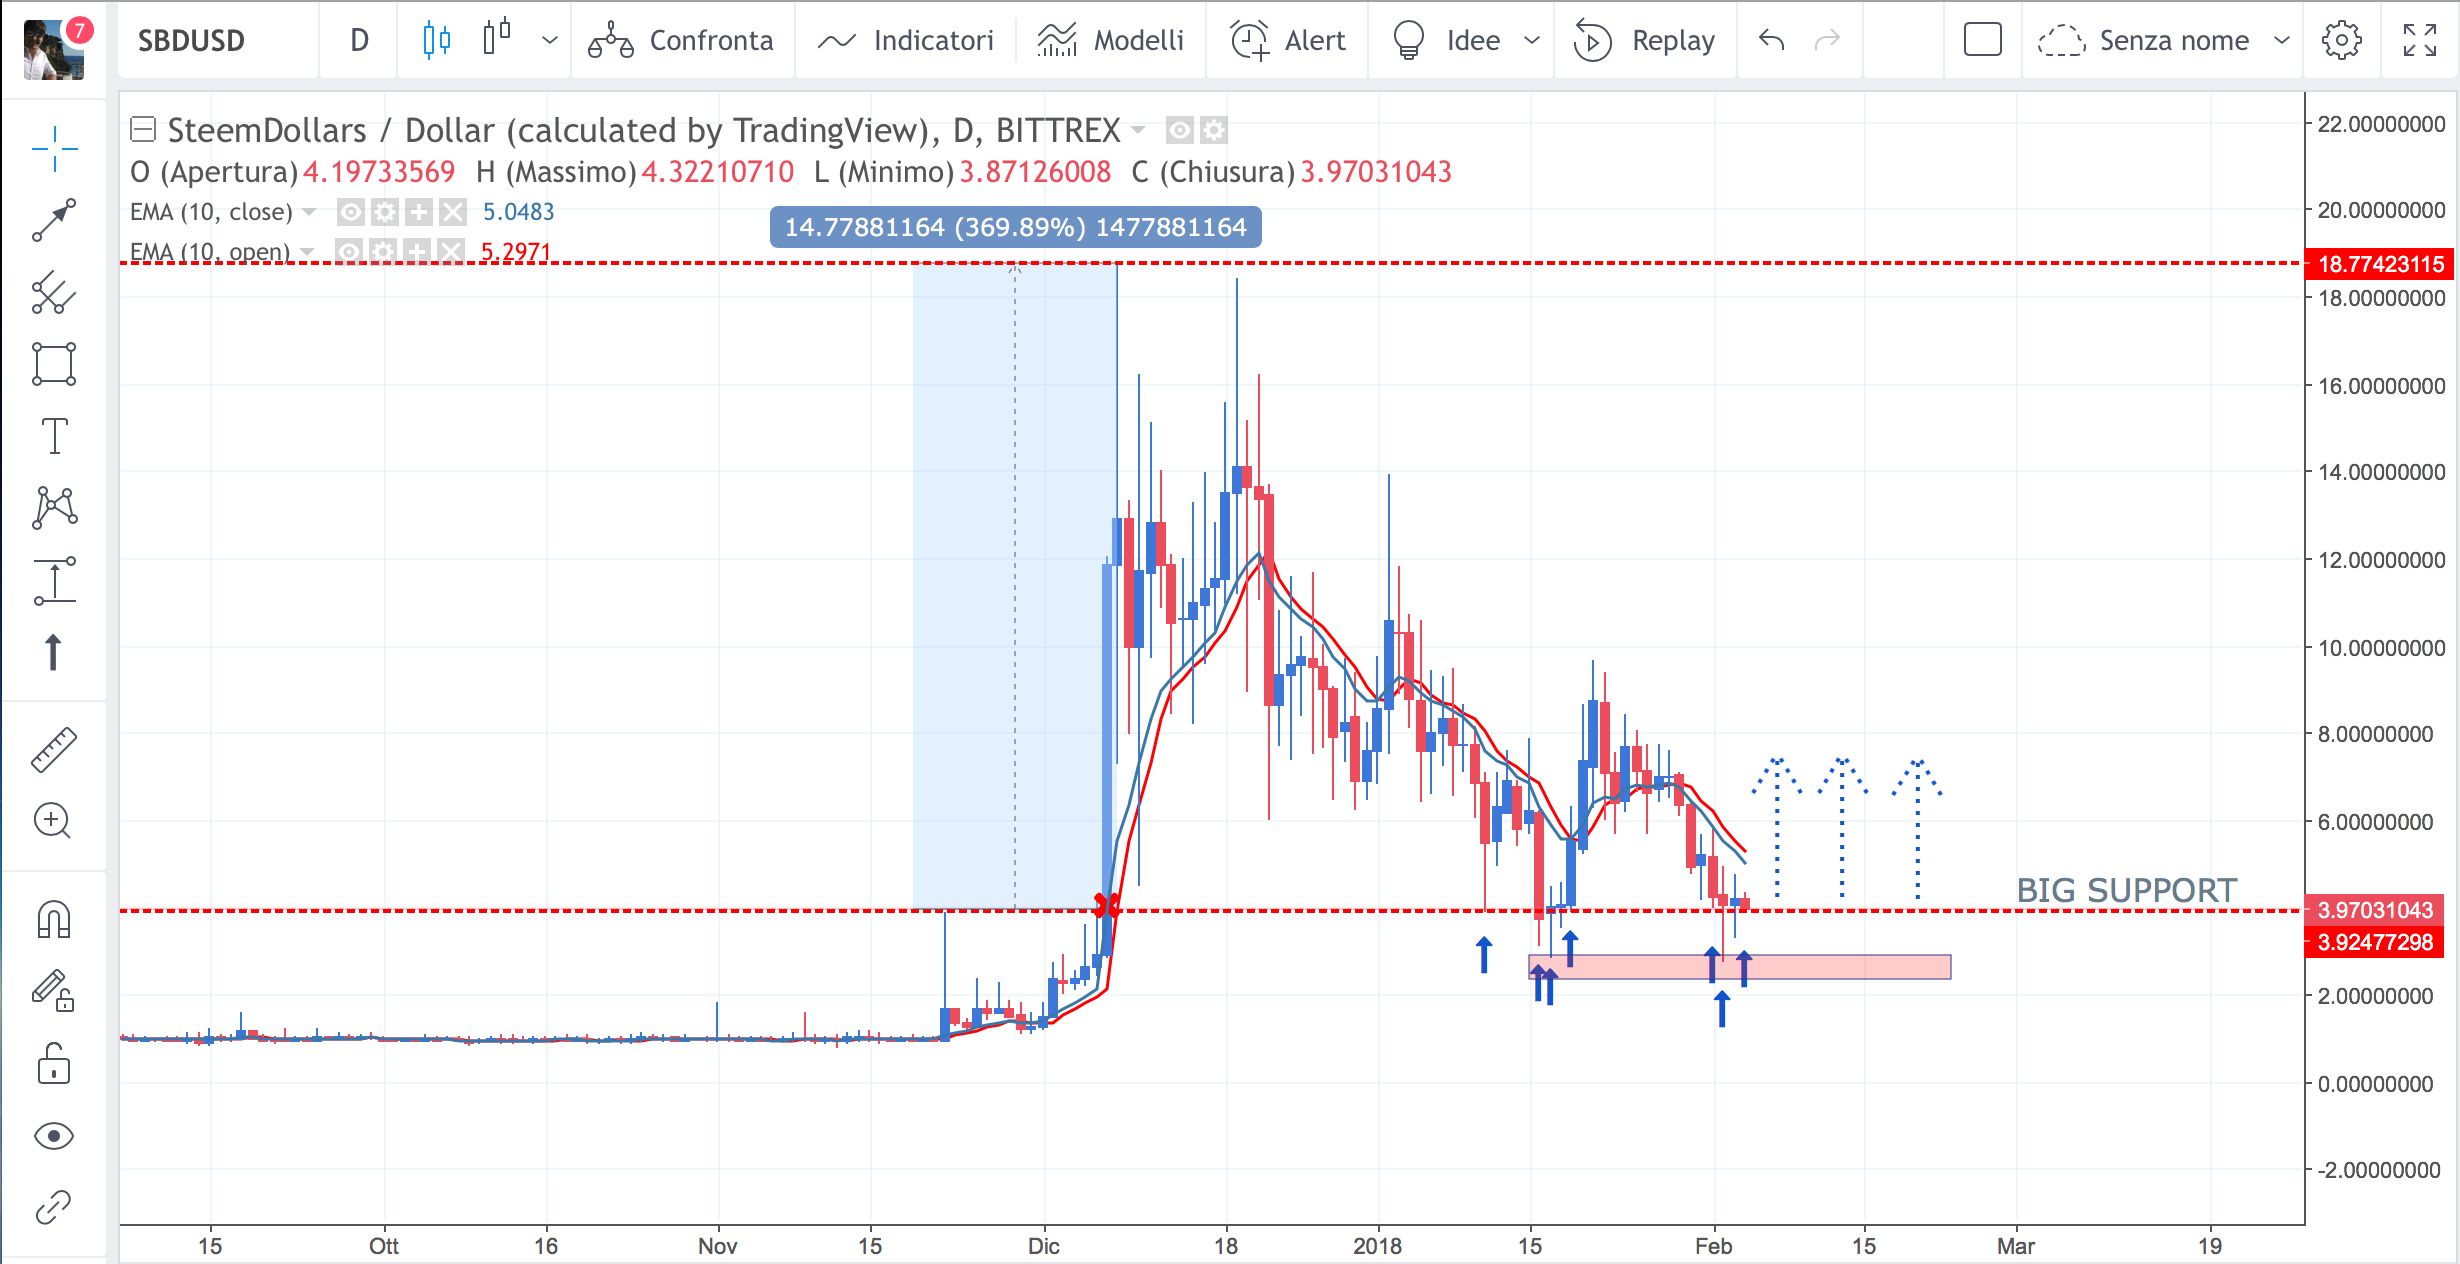
Daily Chart SBD/USD

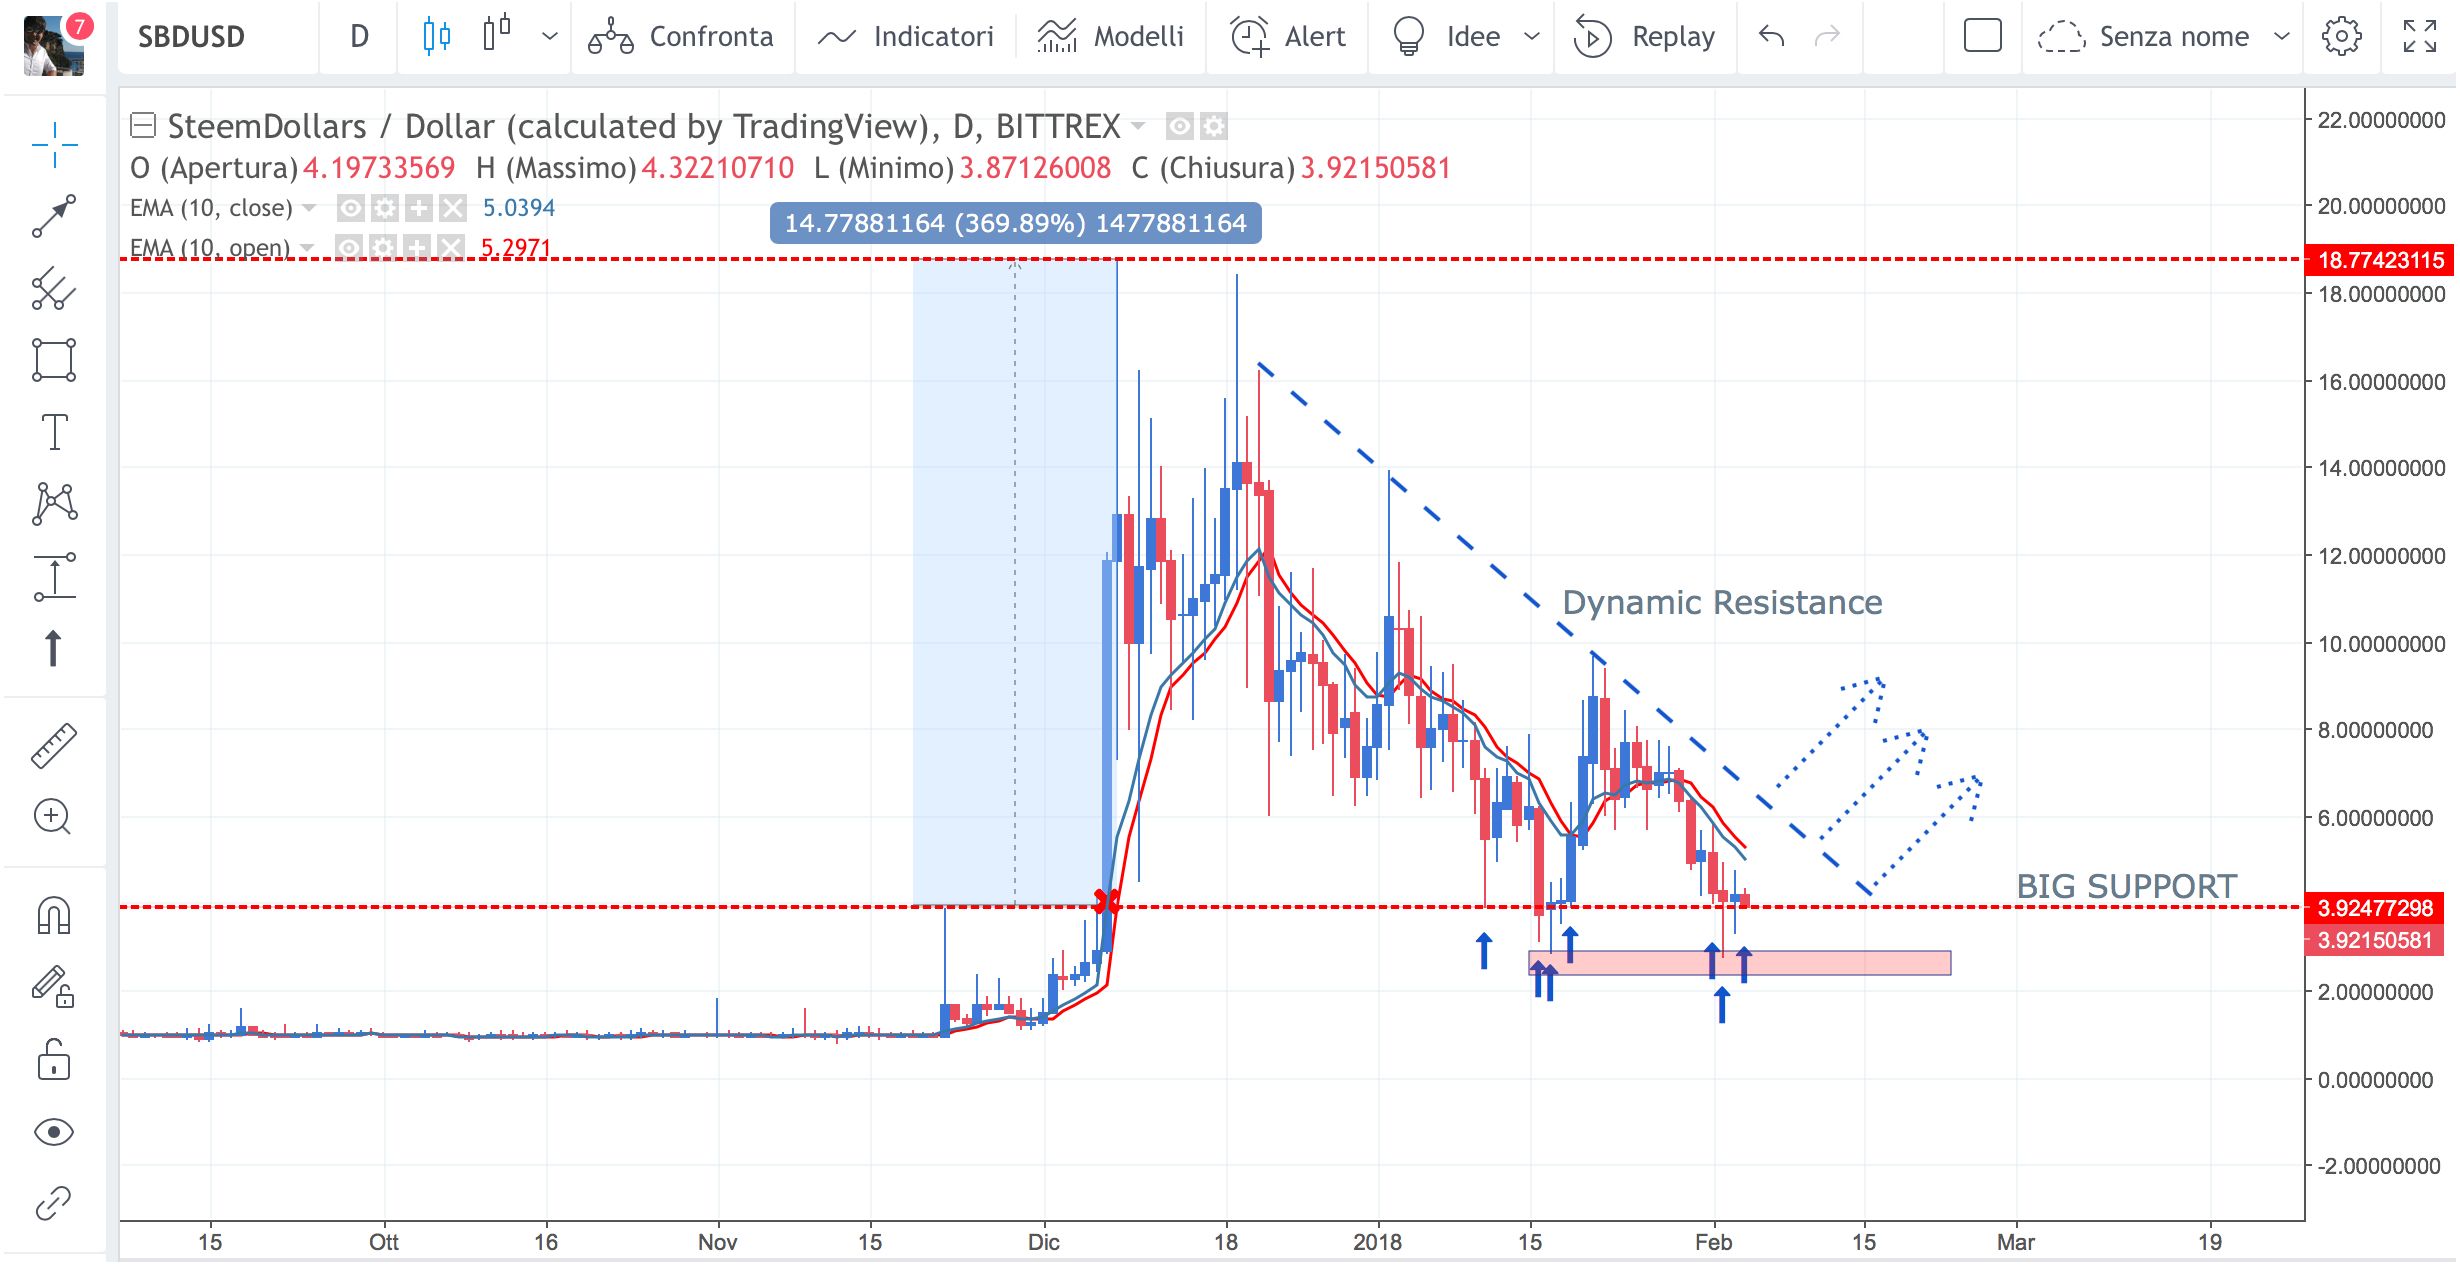
Daily Chart SBD/USD with dynamic resistance
It is interesting to note that the Steem dollar (SBD / USD) as a result of this global crash in the crypto currencies market went to impact on the "big support" in area 4 USD, what was until 7 December 2017 a "big resistance".
The graph shown above is in a daily time-frame, and we can see how every time I went to test this level overcoming it to the downside, at the end there was always a return around 4 dollars, reflecting the fact that level is really important for investors. Let's say that today it represents a sort of watershed.
Now, a closing of today's candle today below the 3.60USD could mean for the Steem dollar a continuation of bearish trend that could bring it back to the stalled phase around 1.0 - 1.5 USD that characterized this asset for much of 2017 .
Obviously, as a user of Steemit, I do not wish this to happen, but as an analyst I must be aware that this possibility exists.
What I hope is that the big support holds and that this may be the beginning of a new bullish phase that would make us happy steemians.
I think we can talk about a start of a real bullish phase for the Steem Dollar only if there is the break out of the dynamic resistance drawn in the second chart, and then the break with a candle closing daily above the big support and simultaneously above the dynamic resistance.
Disclaimer
This is just my trading idea and it is not a financial advice.

Steem Dollar: analisi tecnica del 4 febbraio 2018
È interessante notare come lo Steem dollar (SBD/USD) a seguito di questo crollo globale del mercato delle cripto valute sia andato ad impattare proprio sul "big support" in area 4 USD, quello che è stato fino al 7 dicembre 2017 una "big resistance".
Il grafico qui sopra mostrato è in un time-frame giornaliero, e possiamo notare come ogni qual volta sia andato a testare questo livello superandolo al ribasso, alla fine c'è sempre stato un ritorno intorno ai 4 dollari, a testimonianza del fatto che tale livello è davvero importante per gli investitori. Diciamo che ad oggi rappresenta una sorta di spartiacque.
Adesso, una chiusura della candela daily di oggi al di sotto dei 3.60USD potrebbe significare per lo Steem dollar una continuazione di trend bearish che potrebbe portarlo nuovamente nella fase di stallo intorno ad 1.0 - 1.5 USD che ha caratterizzato questo asset per gran parte del 2017.
Ovviamente, da utente di Steemit non mi auguro che ciò avvenga, ma da analista devo essere cosciente che c'è questa possibilità.
Quello che invece mi auguro è che il big support regga e che questa possa essere l'inizio di una nuova fase bullish che tanto farebbe felici noi steemians.
Io ritengo che si possa parlare di un inizio di una vera e propria fase bullish per lo Steem Dollar solo se ci sarà il break out della resistenza dinamica disegnata nel secondo grafico, e quindi la rottura con chiusura di una candela daily al di sopra del big support e contemporaneamente al di sopra della dynamic resistance.
Disclaimer
Questa è solo una mia idea di trading e non è un consiglio finanziario.
In my opinion you can't use technical analysis for SBD. You can only use fundamental analysis. SBD has a high inflation as long as the price is above $1. Currently the inflation rate is 9.6% per week or 500% per year. This regulation mechanism results in a SBD price of $1 in the mid to long term.
This chart you'll also find in my weekly steemit statistics:
https://steemit.com/steem/@sevenseals/steem-statistic-charts-week-05-new-activity-chart-and-country-statistic-added
Hi Sevenseals,
I respect your opinion but I do not agree with it. In the following chart I entered the Fibonacci levels and highlighted with green rectangles the various areas where the price of SBD / USD has respected the Fibonacci levels.
Apparently these levels are respected.
I fully agree that fundamental analysis is important, indeed, I think it is more important than technical analysis, and this we can see with the latest crash of the Steem Dollar, but I think that to identify good entry into the market, to identify trading signals, technical analysis is to be kept in mind.
This is my opinion.
Sure, you can intermediately trade these signals.
This post has received a 41.72 % upvote from @aksdwi thanks to: @cloudaut.
Excellent publication thank you for that information so we are up to date with the success events
In my opinion better for sbd to pegged with usd. You know we need a hiding place during bear run.
Thank you cloudaut for making a transfer to me for an upvote of 11.97% on this post!
Half of your bid goes to @budgets which funds growth projects for Steem like our top 25 posts on Steem!
The other half helps holders of Steem power earn about 60% APR on a delegation to me!
For help, will you please visit https://jerrybanfield.com/contact/ because I check my discord server daily?
To learn more about Steem, will you please use http://steem.guide/ because this URL forwards to my most recently updated complete Steem tutorial?
This post has received a 8.42 % upvote from @boomerang thanks to: @cloudaut
You got a 53.18% upvote from @minnowvotes courtesy of @cloudaut!
Post eccellente ed info interessanti!