STEEM "<> <>" THE GOLDEN CROSS CHART PATTERN
🐒 The Golden Cross chart pattern for Steem is in full force .
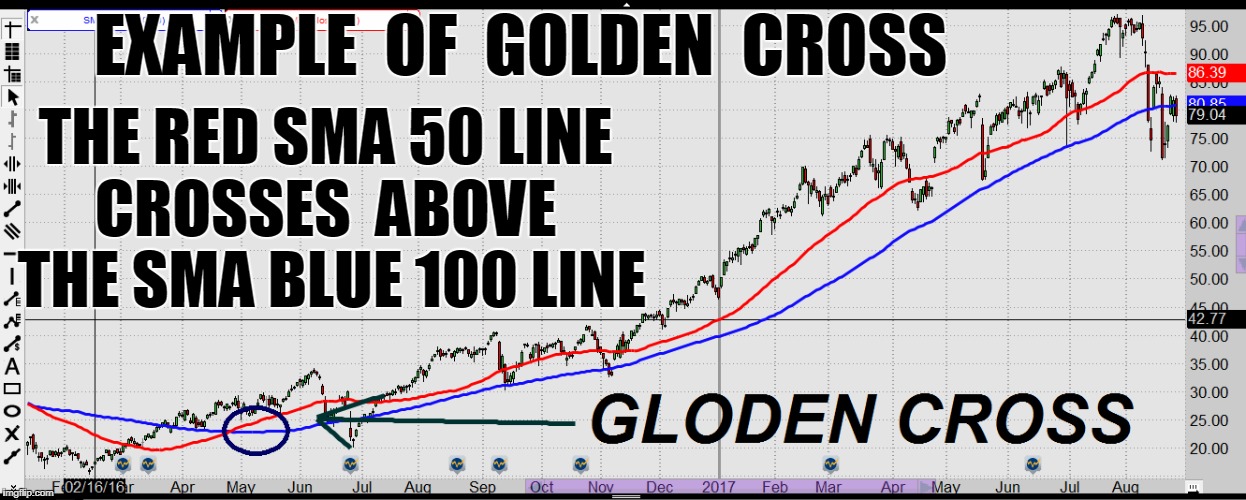
What is a 'Golden Cross'
The golden cross is a bullish breakout pattern formed from a crossover involving a security's ( or Cryptocurrency ) short-term moving average (such as the 50-day moving average) breaking above its long-term moving average (such as 100-day moving average) or resistance level. As long-term indicators carry more weight, the golden cross indicates a bull market on the horizon and is reinforced by high trading volumes.
Read more: Golden Cross http://www.investopedia.com/terms/g/goldencross.asp#ixzz4qhZSNYLA
🐒
🐒
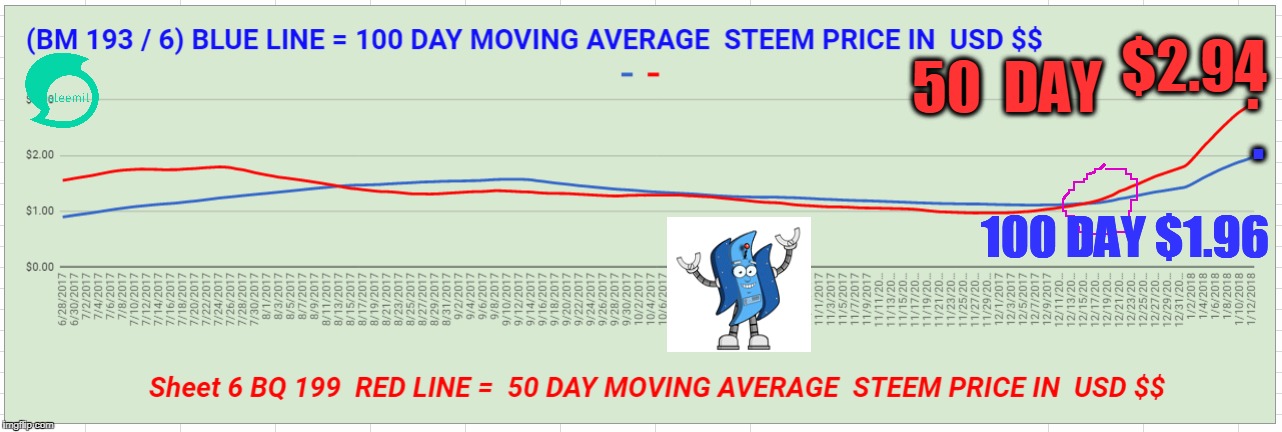
Below : STEEM PRICE
BLUE LINE : = 100 day Simple Moving Average of the price of Steem
RED LINE : = 50 day Simple Moving Average of the price of Steem
🐒
Below : USD $$ DOLLAR VOLUME OF STEEM TRADED
BLUE LINE : = 100 DAY MOVING AVERAGE DAILY USD $$ DOLLAR VOLUME OF STEEM TRADED
RED LINE : = 50 DAY MOVING AVERAGE DAILY USD $$ DOLLAR VOLUME OF STEEM TRADED

🐒
SUMMARY
🐒 The SMA 50 is ABOVE the SMA 100 on both charts .
.
🐒
DISCLAIMER : This content is for informational, educational and research purposes only.
Please get the advice of a competent financial advisor before investing your money in any financial instrument.
It is strongly recommended that you consult with a licensed financial professional before using any information provided here . Any market data or news commentary used here is for illustrative and informational purposes only.
Trading involves a high level of risk. Future results can be dramatically different from the opinions expressed herein. Past performance does not guarantee future performance. Consult an investment professional before investing.
All ideas , trade signals , opinions and/or forecasts are for informational, educational and research purposes only and should not be construed as a recommendation to invest, trade, and/or speculate . Any investments made in light of these ideas, trade signals, opinions, and/or forecasts, expressed or implied herein, are committed at your own risk. I am not an investment advisor, information shared here is for informational, educational and research purposes only and not a recommendation to buy or sell anything .
🐒
Please voice your opinions in the comments below.
🐒 The Golden Cross Chart Pattern is in FULL FORCE The SMA 50 is ABOVE the SMA 100 on both charts .
🐒 The Golden Cross Chart Pattern is in FULL FORCE The SMA 50 is ABOVE the SMA 100 on both charts .tnx for upvote and Sdb
Thanks for sharing! I've heard the term thrown around often, but never had it explained. I was always looking for something in the shape of a cross, not the short term MA crossing over the long therm MA on a rise. I could never find the cross shaped pattern! lol
hey george jaja I woud like you support
steem will increase and increase until it reached to moon
🐒 The Golden Cross Chart Pattern is in FULL FORCE The SMA 50 is ABOVE the SMA 100 on both charts .
look like the surge has started again, this is great to seean upward trend finaly after a bad market week for the coins
very in portent post best of luck
great post bro i really like this type post becuse this post is very helpfull ...wish you best of luck keep posting....
All ideas , trade signals , opinions and/or forecasts are for informational, educational and research purposes only and should not be construed as a recommendation to invest, trade, and/or speculate . Any investments made in light of these ideas, trade signals, opinions, and/or forecasts, expressed or implied herein, are committed at your own risk. I am not an investment advisor, information shared here is for informational, educational and research purposes only and not a recommendation to buy or sell anything .Of course !
Love the post and my followers have to share from this wonderful knowledge. #Resteemed