Steem Statistic Charts Week 27 --- Including Country Statistics
Compared to the last week, price of Steem decreased by 7.7% and the SBD price increased by 5.7%. While activity key figures have fallen, the total accounts and daily unique visitors have risen slightly. I think the activity has decreased due to the holiday period.
Inflation Rates
Steem: 8.82% per year
SBD: 0,53% per week
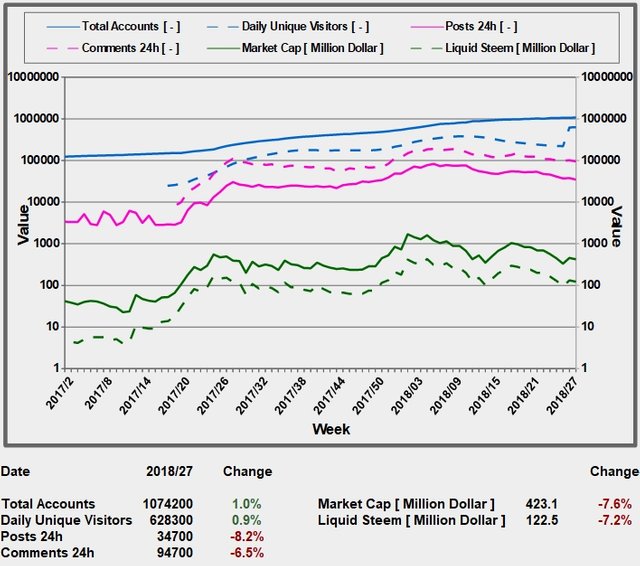
All-In-One-Chart
The all-in-one-chart shows all activity values and monetary values in a logarithmic scaling where you can see the correlation between the curves.
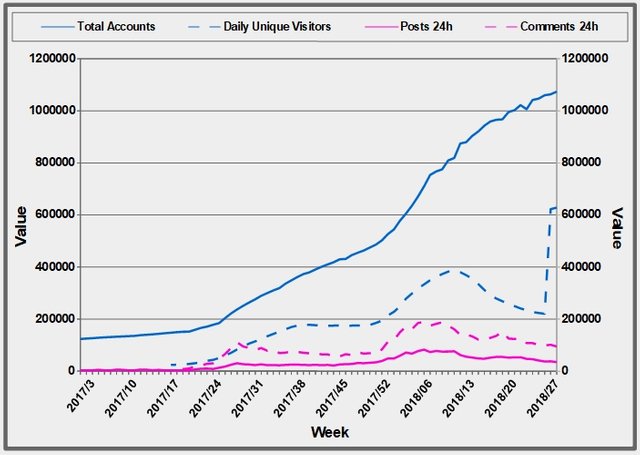
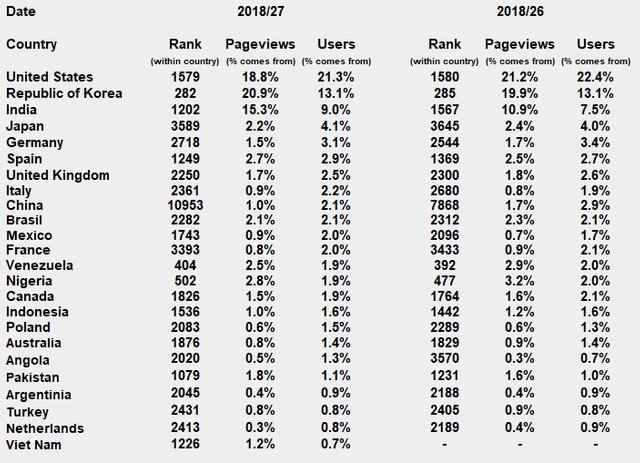
Acivity Chart and Country Statistics
This Chart shows the activity numbers of Steem in a linear scaling. Below the diagram is the top 24 country statistics with country ranking and the share of countries in page views and users.
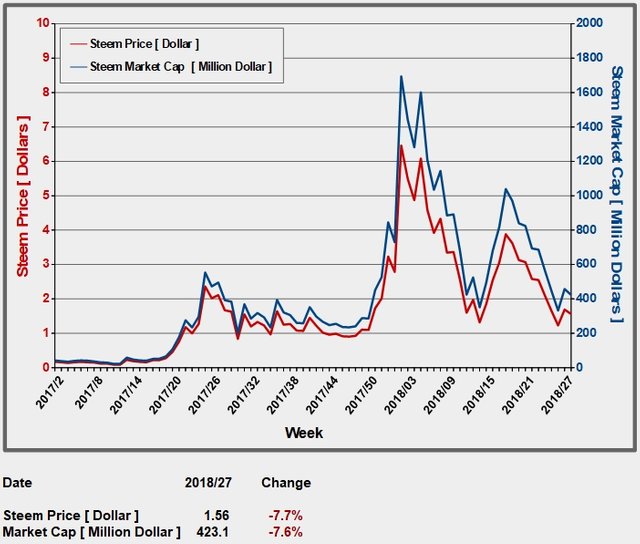
Steem Price Chart
The following chart shows the steem price and market capitalization in a linear scaling.
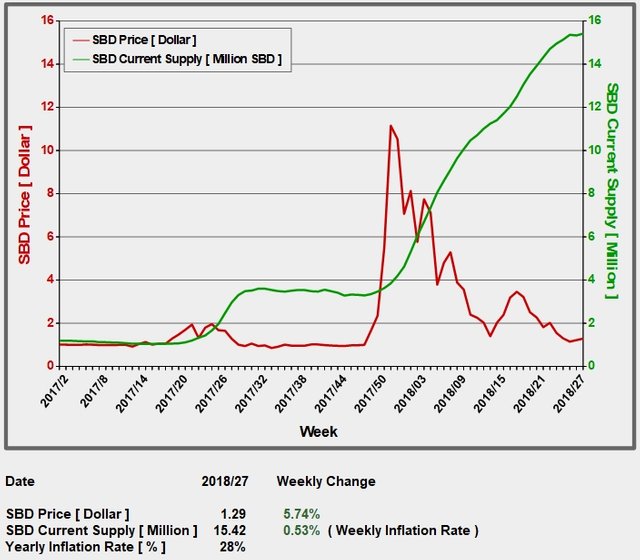
SBD Chart
The following chart shows the SBD price and SBD supply in linear scaling. The inflation rate of SBD is now 3.8% per week.
My goal is to offer the best statistics on Steemit, which are presented in a way that everyone can understand. So don't hesitate to give me advice for improvements.
Here are the links to my last five weekly statistics:
https://steemit.com/steemit/@sevenseals/steem-statistic-charts-week-26-including-country-statistics
https://steemit.com/steemit/@sevenseals/steem-statistic-charts-week-24-including-country-statistics
https://steemit.com/steemit/@sevenseals/steem-statistic-charts-week-23-including-country-statistics
https://steemit.com/steemit/@sevenseals/steem-statistic-charts-week-21-including-country-statistics
https://steemit.com/steemit/@sevenseals/steem-statistic-charts-week-18-including-country-statistics
----------- Comments will be voted. -----------!
all link very useful
wow