[Week 4] Google IT Support Professional Certificate #34 | Course 5 IT Security: Defense against the digital dark arts {Part 2}
.jpg)
This is Part 2 for part 1 Click here: http://bit.ly/2pbayiO
6. Wireless Hardening
Now that we've covered the security options available for protecting wireless networks, what do you think the most secure option would be? In an ideal world, we'd all be protecting our wireless networks using 802.1X with EAP-TLS. It offers arguably the best security available, assuming proper and secure handling of the PKI aspects of it. But, this option also requires a ton of added complexity and overhead. This is because it requires the use of a radius server and an additional authentication back-end at a minimum. If EAP-TLS is implemented, then all the public key infrastructure components will also be necessary. This adds even more complexity and management overhead. Not only do you have to securely deploy PKI on the back-end for certificate management, but a system must be in place to sign the client's certificates. You also have to distribute them to each client that would be authenticating to the network. This is usually more overhead than many companies are willing to take on, because of the security versus convenience trade-off involved. If 802.1X is too complicated for a company, the next best alternative would be WPA2 with AES/CCMP mode,. But to protect against brute force or rainbow table attacks, we should take some steps to raise the computational bar. A long and complex passphrase that wouldn't be found in a dictionary would increase the amount of time and resources an attacker would need to break the passphrase. Changing the SSID to something uncommon and unique, would also make rainbow tables attack less likely. It would require an attacker to do the computations themselves, increasing the time and resources required to pull off an attack. When using a long and complex Wi-Fi password, you might be tempted to use WPS to join clients to the network. But we saw earlier that this might not be a good idea from a security perspective. In practice, you won't see WPS enabled in an enterprise environment, because it's a consumer-oriented technology. If your company values security over convenience, you should make sure that WPS isn't enabled on your APs. Make sure this feature is disabled on your AP's Management Council. You might want to also verify the feature is actually disabled using a tool like Wash, which scans and enumerates a piece that have WPS enabled. This independent verification is recommended, since some router manufacturers don't allow you to disable it. In some cases, disabling the feature through the management console doesn't actually disable the feature. Ready for another quiz? Don't worry, it's just a practice one, to help make sure you're getting all this wireless info wired into your brain.
7. Sniffing the Network
Now, in order to monitor what type of traffic is on your network, you need a mechanism to capture packets from network traffic for analysis and potential logging. Packet Sniffing or Packet Capture, is a process of intercepting network packets in their entirety for analysis. It's an invaluable tool for IT support specialists to troubleshoot issues. There are lots of tools that make this really easy to do. Before we dive into the details of how to use them, let's cover some basic concepts of Packet Sniffing. By default, network interfaces and the networking software stack on an OS are going to behave like a well-mannered interface, They will only be accepting and processing packets that are addressed with specific interface address usually identified by a MAC address. If a packet with a different destination address is encountered, the interface will just drop the packet. But, if we wanted to capture all packets that an interface is able to see, like when we're monitoring all network traffic on a network segment, this behavior would be a pain for us. To override this, we can place the interface into what's called Promiscuous Mode. This is a special mode for Ethernet network interfaces that basically says, "Give me all the packets." Instead of only accepting and handling packets destined for its address, it will now accept and process any packet that it sees. This is much more useful for network analysis or monitoring purposes. I should also call out that admin or group privileges are needed to place an interface into promiscuous mode and to begin to capture packets. Details for various platforms on how to get into promiscuous mode can be found in the supplemental reading section. Many packet capture tools will handle this for you too. Another super important thing to consider when you perform packet captures is whether you have access to the traffic you like to capture and monitor. Let's say you wanted to analyze all traffic between hosts connected to a switch and your machine is also connected to a port on the switch. What traffic would you be able to see in this case?
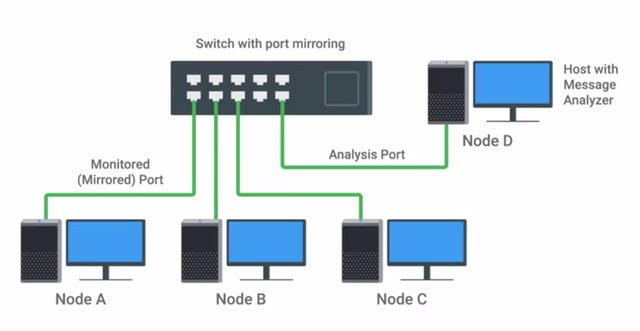
Because this is a switch, the only traffic you'd be able to capture would be traffic from your host or destined for your host. That's not very useful in letting you analyze other hosts traffic. If the packets aren't going to be sent to your interface in the first place, Promiscuous Mode won't help you see them. But, if your machine was inserted between the uplink port of the switch and the uplink device further upstream now you'd have access to all packets in and out of that local network segment. Enterprise manage switches usually have a feature called Port Mirroring, which helps with this type of scenario. Port Mirroring, allows the switch to take all packets from a specified port, port range, or the entire VLAN and mirror the packets to a specified switch port. This lets you gain access to all packets passing on a switch in a more convenient and secure way. There's another handy though less advanced way that you can get access to packets in a switched network environment. You can insert a hub into the topology with the device or devices you'd like to monitor traffic on, connected to the hub and our monitoring machine. Hubs are a quick and dirty way of getting packets mirrored to your capture interface. They obviously have drawbacks though, like reduced throughput and the potential for introducing collisions. If you capture packets from a wireless network, the process is slightly different. Promiscuous Mode applied to a wireless device would allow the wireless client to process and receive packets from the network it's associated with destined for other clients. But, if we wanted to capture and analyze all wireless traffic that we're able to receive in the immediate area, we can place our wireless interface into a mode called monitor mode. Monitor mode, allows us to scan across channels to see all wireless traffic being sent by APs and clients. It doesn't matter what networks they're intended for and it wouldn't require the client device to be associated or connected to any wireless network. To capture wireless traffic, all you need is an interface placed into monitor mode. Just like enabling promiscuous mode, this can be done with a simple command, but usually, the tools used for wireless packet captures can handle the enabling and disabling of the mode for you. You need to be near enough to the AP and client to receive a signal, and then you can begin capturing traffic right out of the air. There are a number of open source wireless capture and monitoring utilities, like Aircrack-ng and Kismet. It's important to call out that if a wireless network is encrypted, you can still capture the packets, but you won't be able to decode the traffic payloads without knowing the password for the wireless network. So, now we're able to get access to some traffic we like to monitor. So, what do we do next? We need tools to help us actually do the capture and the analysis. We'll learn more about those in the next lesson.
8. Wireshark and tcpdump
Tcpdump is a super popular, lightweight command-line based utility that you can use to capture and analyze packets. Tcpdump uses the open source libpcap library. That's a very popular packet capture library that's used in a lot of packet capture and analysis tools.
Tcpdump also supports writing packet captures to a file for later analysis, sharing, or replaying traffic. It also supports reading packet captures back from a file. Tcpdump's default operating mode is to provide a brief packet analysis. It converts key information from layers three and up into human readable formats. Then it prints information about each packet to standard out, or directly into your terminal. It does things like converting the source and destination IP addresses into the dotted quad format we're most used to. And it shows the port numbers being used by the communications.
Let's quickly walk through the output of a sample tcpdump.
The first bit of information is fairly straightforward. It's a timestamp that represents when the packet on this line was processed by the kernel, in local time.
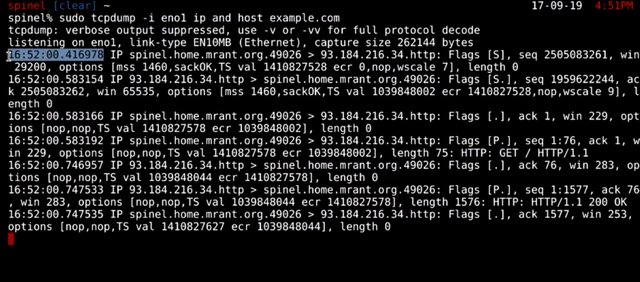
Next the layer three protocol is identified, in this case, it's IPv4. After this, the connection quad is shown. This is the source address, source port, destination address, and destination port.
Next, the TCP flags and the TCP sequence number are set on the packet, if there are any.
This is followed by the ack number, TCP window size, then TCP options, if there are any set. Finally we have payload size in bytes. Remember these from a few lessons ago, when we covered networking? Tcpdump allows us to actually inspect these values from packets directly. I want to call out that tcpdump, by default, will attempt to resolve host addresses to hostnames. It'll also replace port numbers with commonly associated services that use these ports. You could override this behavior with a -n flag.
It's also possible to view the actual raw data that makes up the packet. This is represented as hexadecimal digits, by using the -x flag, or capital X if you want the hex in ASCII interpretation of the data.
Remember that packets are just collections of data, or groupings of ones and zeros. They represent information depending on the values of this data, and where they appear in the data stream. Think back to packet headers, and how those are structured and formatted. The view tcpdump gives us lets us see the data that fits into the various fields that make up the headers for layers in a packet.
Wireshark is another packet capture and analysis tool that you can use, but it's way more powerful when it comes to application and packet analysis, compared to tcpdump. It's a graphical utility that also uses the libpcap library for capture and interpretation of packets. But it's way more extensible when it comes to protocol and application analysis.
While tcpdump can do basic analysis of some types of traffic, like DNS queries and answers, Wireshark can do way more. Wireshark can decode encrypted payloads if the encryption key is known. It can identify and extract data payloads from file transfers through protocols like SMB or HTTP. Wireshark's understanding of application level protocols even extends to its filter strings. This allows filter rules like finding HTTP requests with specific strings in the URL, which would look like, http.request.uri matches "q=wireshark". That filter string would locate packets in our capture that contain a URL request that has the specified string within it. In this case it would match a query parameter from a URL searching for Wireshark. While this could be done using tcpdump, it's much easier using Wireshark.
Let's take a quick look at the Wireshark interface, which is divided into thirds. The list of packets are up top, followed by the layered representation of a selected packet from the list.
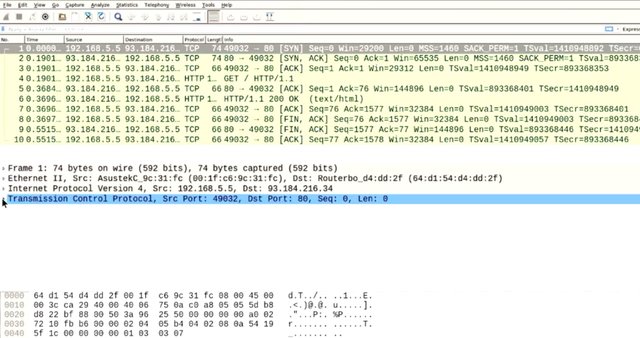
Lastly the Hex and ASCII representation of the selected packet are at the bottom. The packet list view is color coded to distinguish between different types of traffic in the capture. The color coded is user configurable, the defaults are green for TCP packets, light blue for UDP traffic, and dark blue for DNS traffic. Black also highlights problematic TCP packets, like out of order, or repeated packets. Above the packet list pane, is a display filter box, which allows complex filtration of packets to be shown. This is different from capture filters, which follows the libpcap standard, along with tcpdump. Wireshark's deep understanding of protocols allows filtering by protocols, along with their specific fields. Since there are over 2,000 protocols supported by Wireshark, we won't cover them in detail. You may want to take a look at the supplementary readings, which shows a broad range of protocols understood by Wireshark. Not only does Wireshark have very handy protocol handling infiltration, it also understands and can follow tcp streams or sessions. This lets you quickly reassemble and view both sides of a tcp session, so you can easily view the full two-way exchange of information between parties. Some other neat features of Wireshark is its ability to decode WPA and WEP encrypted wireless packets, if the passphrase is known. It's also able to view Bluetooth traffic with the right hardware, along with USB traffic, and other protocols like Zigbee. It also supports file carving, or extracting data payloads from files transferred over unencrypted protocols, like HTTP file transfers or FTP. And it's able to extract audio streams from unencrypted VOIP traffic, so basically [LAUGH] Wireshark is awesome.
You might be wondering how packet capturing analysis fits into security at this point. Like logs analysis, traffic analysis is also an important part of network security. Traffic analysis is done using packet captures and packet analysis. Traffic on a network is basically a flow of packets. Now being able to capture and inspect those packets is important to understanding what type of traffic is flowing on our networks that we'd like to protect.
For more information on this check out the following links:
Promiscuous Mode on Linux
https://it.awroblew.biz/linux-how-to-checkenable-promiscuous-mode/
Enabling promiscuous mode on Mac OS X
https://danielmiessler.com/blog/entering-promiscuous-mode-os-x/
Enabling promiscuous mode on Windows
http://lifeofageekadmin.com/how-to-manually-change-your-nic-to-promiscuous-mode-on-windows-72008-r2/
9. Intrusion Detection/Prevention Systems
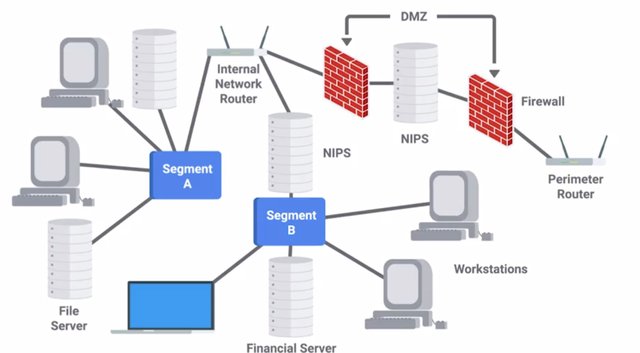
We covered Packet Capture and Analysis, which is related to our next topic, Intrusion Detection and Prevention Systems or IDS/IPS. IDS or IPS systems operate by monitoring network traffic and analyzing it. As an IT support specialist, you may need to support the underlying platform that the IDS/IPS runs on. You might also need to maintain the system itself, ensuring that rules are updated, and you may even need to respond to alerts. So, what exactly do IDS and IPS systems do? They look for matching behavior or characteristics that would indicate malicious traffic. The difference between an IDS and an IPS system, is that IDS is only a detection system. It won't take action to block or prevent an attack, when one is detected, it will only log an alert. But an IPS system can adjust firewall rules on the fly, to block or drop the malicious traffic when it's detected. IDS and IPS system guess an idea systems can either be host based or network based. In the case of a Network Intrusion Detection System or NIDS, the detection system would be deployed somewhere on a network, where it can monitor traffic for a network segment or sub net. A host based intrusion detection system would be a software deployed on the host that monitors traffic to and from that host only. It may also monitor system files for unauthorized changes. NIDS systems resemble firewalls in a lot of ways. But a firewall is designed to prevent intrusions by blocking potentially malicious traffic coming from outside,
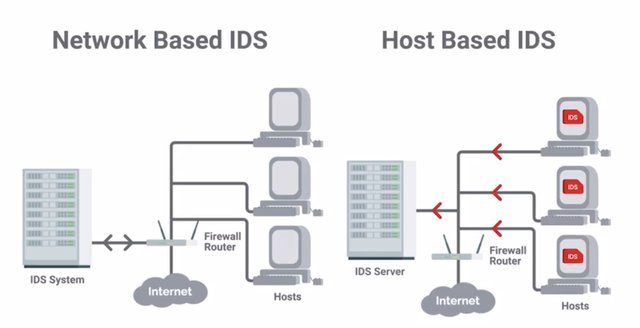
and enforce ackles between networks. NIDS systems are meant to detect and alert on potential malicious activity coming from within the network. Plus, firewalls only have visibility of traffic flowing between networks they've set up to protect. They generally wouldn't have visibility of traffic between hosts inside the network. So, the location of the NIDS must be considered carefully when you deploy a system. It needs to be located in the network topology, in a way that it has access to the traffic we'd like to monitor. A good way that you can get access to network traffic is using the port mirroring functionality found in many enterprise switches. This allows all packets on a port, port range, or entire VLAN to be mirrored to another port, where NIDS host would be connected. With this configuration, our NIDS machine would be able to see all packets flowing in and out of hosts on the switch segment. This lets us monitor host to host communications, and traffic from hosts to external networks, like the internet. The NIDS hosts would analyzed this traffic by enabling promiscuous mode on the analysis port. This is the network interface that's connected to the mirror port on our switch, so it can see all packets being passed, and perform an analysis on the traffic. Since this interface is used for receiving mirrored packets from the network we'd like to monitor, a NIDS host must have at least two network interfaces. One is for monitoring an analysis, and a separate one is for connecting to our network for management and administrative purposes. Some popular NID or NIP systems are Snort, Suricata, and Bro NIDS, which you can read about more in the supplementary readings. Placement of a NIP system or Network Intrusion Prevention system, would differ from a NIDS system. This is because of a prevention system being able to take action against a suspected malicious traffic. In order for a NIPS device to block or drop traffic from a detected threat, it must be placed in line with the traffic being monitored. This means, that the traffic that's being monitored must pass through the NIPS device. If it wasn't the case, the NIPS host wouldn't be able to take action on suspected traffic. Think of it this way, a NIDS device is a passive observer that only watches the traffic, and sends an alert if it sees something. This is unlike a NIPS device, which not only monitors traffic, but can take action on the traffic it's monitoring, usually by blocking or dropping the traffic. The detection of threats or malicious traffic is usually handled through signature based detection, similar to how antivirus software detects malware. As an IT Support Specialist, you might be in charge of maintaining the IDS or IPS setup, which would include ensuring that rules and signatures are up to date. Signatures are unique characteristics of known malicious traffic. They might be specific sequences of packets, or packets with certain values encoded in the specific header field. This allows Intrusion Detection and Prevention Systems from easily
and quickly recognizing known bad traffic from sources like botnets, worms, and other common attack vectors on the internet. But similar to antivirus, less common are targeted attacks might not be detected by a signature based system, since they're might not be signatures developed for these cases. So, it's also possible to create custom rules to match traffic that might be considered suspicious, but not necessarily malicious. This would allow investigators to look into the traffic in more detail to determine the badness level. If the traffic is found to be malicious, a signature can be developed from the traffic, and incorporate it into the system. What actually happens when a NIDS system detects something malicious? This is configurable, but usually the NIDS system would log the detection event along with a full packet capture of the malicious traffic. An alert would also usually be triggered to notify the investigating team to look in the middle of the night if it's determined to be a really high severity and urgent. These alerts would usually also include reference information linking to a known vulnerability, or some more information about the nature of the alert to help the investigator look into the event. Well, we covered a lot of ground on securing your networks. I hope you feel secure enough to move on. If not, you can review any of these concepts that we've talked about. Once you've done that, it's time for a peer review assessment, to give you some hands on experience with packet sniffing analysis. When you're finished.
To Join this course click on the link below
.jpg)
Google IT Support Professional Certificate http://bit.ly/2JONxKk
LInks to previous weeks Courses.
[Week 3] Google IT Support Professional Certificate #32 | Course 5 IT Security: Defense against the digital dark arts
http://bit.ly/2pesAAQ
[Week 2] Google IT Support Professional Certificate #30 | Course 5 IT Security: Defense against the digital dark arts {Part 1}
http://bit.ly/2x9ffgQ
[Week 1] Google IT Support Professional Certificate #29 | Course 5 IT Security: Defense against the digital dark arts
http://bit.ly/2x8hulk
Google IT Support Professional Certificate #0 | Why you should do this Course? | All details before you join this course.
http://bit.ly/2Oe2t8p
#steemiteducation #Computerscience #education #Growwithgoogle #ITskills #systemadministration #itprofessional
#googleitsupportprofessional
Atlast If you are interested in the IT field, this course, or want to learn Computer Science. If you want to know whats in this course, what skills I learned Follow me @hungryengine. I will guide you through every step of this course and share my knowledge from this course daily.
Support me on this journey and I will always provide you with some of the best career knowledge in Computer Science field.