Crude Oil Prices Fell Despite IEA Iran, Venezuela Supply Warning
CRUDE OIL & GOLD TALKING POINTS:
Crude oil prices swoon even as IEA warns on Iran, Venezuela supply- Gold price spike on soft US CPI data evaporates on firm Fed outlook
- US retail sales and consumer confidence reports now in the spotlight
Crude oil prices declined – suffering the largest daily drop in a month – despite an IEA report warning that lost output from Iran and Venezuela may tighten global supplies and increase costs. The agency also cited risks to demand from trade wars and currency market volatility, which might have captured the markets’ attention. Otherwise, a clear-cut catalyst is not readily apparent.
Meanwhile, gold prices shot higher as the US Dollar weakened following underwhelming CPI data only to swiftly reverse course, finishing the day with a narrow loss. The downturn echoed a rebound in front-end Treasury bond yields alongside steepening of the priced-in rate hike outlook implied in Fed funds futures, hinting that investors reckoned the inflation downtick will not deter oncoming tightening.
US RETAIL SALES, CONSUMER CONFIDENCE DATA EYED
Looking ahead, US retail sales and consumer confidence data headlines an otherwise muted data docket through the week-end. Receipts growth is seen slowing but sentiment is expected to improve. If yesterday’s response to the CPI print proves indicative, the releases’ passing may be more significant than their substance, opening the door for a larger USD recovery that weighs on commodity prices.
See our guide to learn about the long-term forces driving crude oil prices!
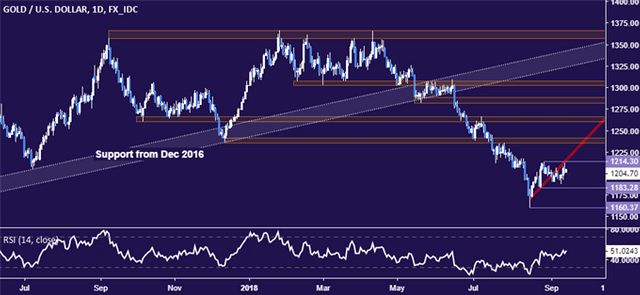
GOLD TECHNICAL ANALYSIS
Gold prices are marking time below the August 28 high at 1214.30. A daily close above that paves the way for a retest of support-turned-resistance in the 1235.24-41.64 area. Alternatively, a push below the August 24 lowat 1183.28 exposes the swing bottom at 1160.37.
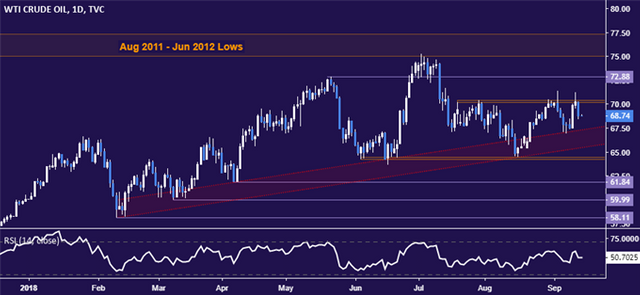
CRUDE OIL TECHNICAL ANALYSIS
Crude oil prices recoiled downward from resistance in the 70.15-41 area. From here, a daily close through the bounds of the rising trend in play since February, now in the 65.47-67.35 area, exposes the support shelf in the 64.26-45 zone. Alternatively, a breach of resistance targets the char inflection point at 72.88.
COMMODITY TRADING RESOURCES
--- Written by Ilya Spivak, Currency Strategist for DailyFX.com
To contact Ilya, use the comments section below or @IlyaSpivak on Twitter
Source link
Posted from my blog with SteemPress : https://satoshinakamotoblog.com/crude-oil-prices-fell-despite-iea-iran-venezuela-supply-warning
This user is on the @buildawhale blacklist for one or more of the following reasons: