[Lets learn Physics #1] What are PV-diagrams and their beauty in Thermodynamics...
1)What are PV-Diagrams??
PV-diagrams( pressure-volume diagrams) or volume-pressure loop or Indicator diagrams are used to describe the corresponding changes in pressure and volume of a thermodynamic system.Not only in thermodynamics, but they are also useful in Cardiovascular physiology and respiratory physiology.
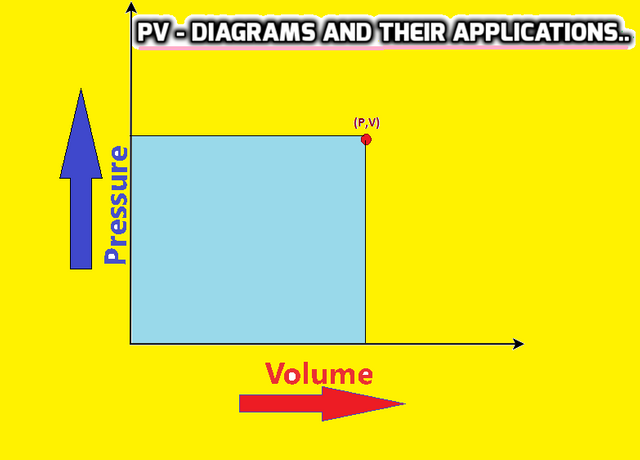
In thermodynamics,there are mainly three thermodynamic parameters i.e Pressure(P), Volume(V) and Temperature (T). But out of three parameters only two Pressure(P) and Volume(V) are sufficient to describe a thermodynamic state completely. If a graph is plotted between the Pressure and Volume of a system undergoing a process, the resulting curve or graph is called a PV-diagram.Thus:-
A graph between pressure and volume of a gas or any system undergoing thermodynamic operation is called PV-diagram.
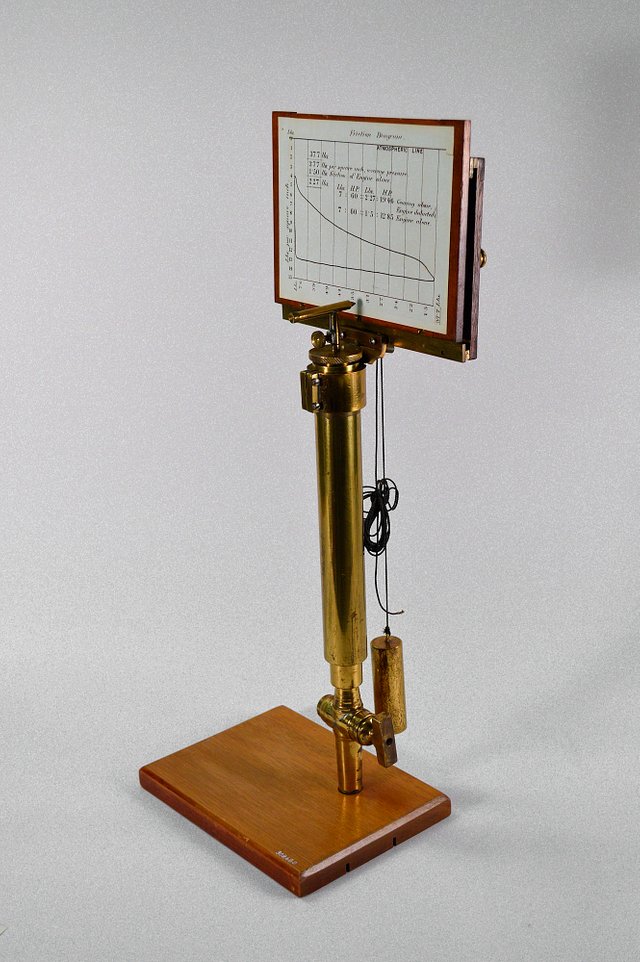
It is called as Indicator diagram as it is used to find the indicated horse power of an Engine.
PV-diagrams were developed in 18th century by James Watt and his employee John Southern as tools for understanding the efficiency of Steam Engines.A simple replica of James Watt's PV-diagram is as shown below:-
Applications of PV-diagrams in Thermodynamics...
PV-diagrams have large number of applications.They are used to find the work done,internal energy, heat of thermodynamic process etc..
2(a). Calculating magnitude of work done by using PV-diagrams..
PV-diagrams are mainly used to calculate the work done of a system during thermodynamic process.
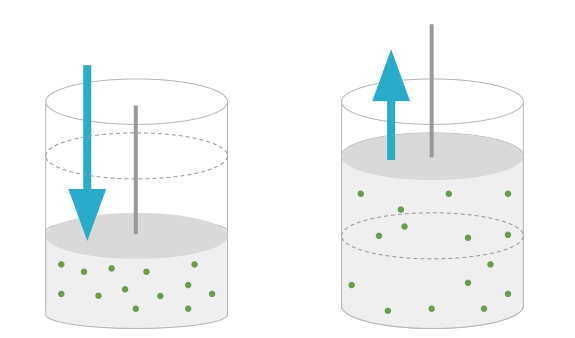
For this, consider a given mass of an ideal gas in a cylinder fitted with frictionless air tight piston.The piston is used to compress the gas by moving it downward or to extend the gas by moving it upward as shown in fig:-
.png)
We know that if volume changes from .gif) to
to .gif) at constant
at constant .gif) , then magnitude of work done is given by:-
, then magnitude of work done is given by:-
.gif)
If we plot a PV-diagram for above work done(i.e. at constant pressure), it will be as shown in fig:-
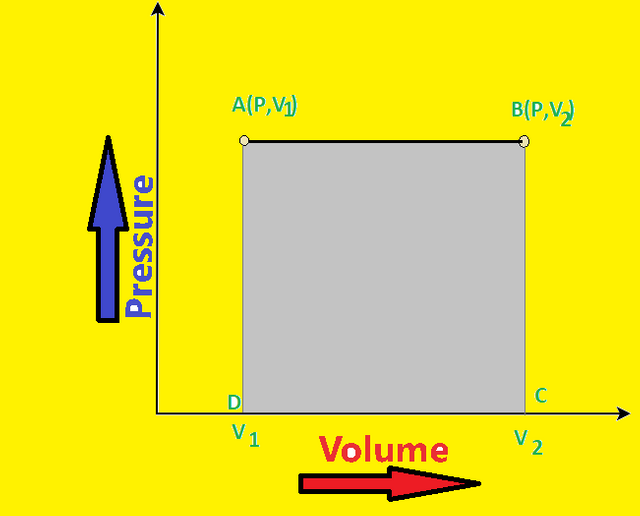
Now as we are taking Pressure as constant,
Therefore:-
.gif) ------(1)
------(1)From above graph, P = AD and -= AB
Therefore, equation (1) becomes:-
.gif)
So, from PV-diagram we can conclude that work done at constant pressure will be equal to area under the graph.
Not only for constant pressure, we can also prove that work done at variable pressure will also equal to area under the graph.
For this let a system whose pressure is changing from .gif) to
to .gif) during expansion i.e. volume changes from to
during expansion i.e. volume changes from to
Now PV-diagram for such a system is shown as below:-
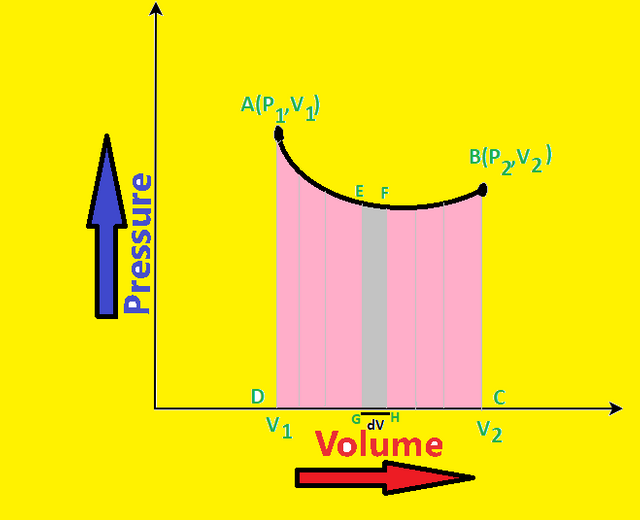
Let AB curve represents the expansion of gas from initial state A to B. Consider E be any point on the curve.The small expansion of gas by a small amount dv is represented by EF. As the expansion is very small and point F is very close to E, hence the pressure corresponding to point E and F can be taken as P.
Therefore, work done during expansion by EF strip = Pdv = area under EFGH
So, to calculate the total work done, the graph can be divided into large number of small strips like EFGH each having small volume element such as dv
Therefore,
Hence, for a pressure variable system during expansion, the area under curve is also equal to total work done.
Using PV-diagram we can also find work done during cyclic process. Let after undergoing series of changes, system is expanding along path ACB and then reverses back to A by following path BDA as shown in fig:-
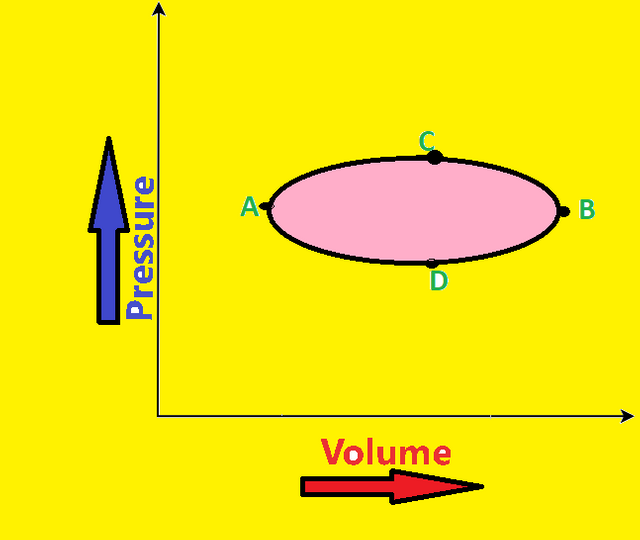
So the work done in this case i.e during cyclic process is equal to area under the curve ACBDA.
So this is how PV-diagrams are useful to calculating the work done of a system during different conditions.
2(b) Calculating sign of Internal Energy from PV-diagram..
By the use of PV-diagrams, we can also tell whether the internal energy of a system is positive or negative. Let me show you how :-
We know that temperature of system is directly proportional to internal energy(U) of the system i.e T∝U and also,We know for an ideal gas, gas equation is:-
where:-
- P is the pressure
- V is the volume
- n is the amount of substance of the gas (in moles)
- R is the gas constant (8.314 J·K−1·mol−1)
- T is the absolute temperature.
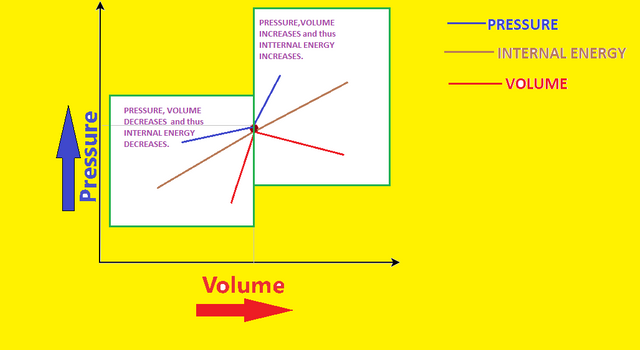
As n and R both are constants, so PV∝T∝U i.e. PV∝U
This means that if pressure and volume of a system increase, its internal energy will also increase and vice versa, which means that if a system in PV-diagram will go to right upper side after process, its internal energy will increase and if the system will go to left down side, then internal energy will decrease as shown by the graph:-
3) Conclusion
So it is clear from the article, the PV-diagrams are our major tools for studying thermodynamic changes. By only using PV-diagrams we can tell the work done, its sign, sign of internal energy and much more.
4) Citations
(https://en.wikipedia.org/wiki/Pressure%E2%80%93volume_diagram)
(https://www.khanacademy.org/science/physics/thermodynamics/laws-of-thermodynamics/a/what-are-pv-diagrams) (image + some content)
(http://americanhistory.si.edu/collections/search/object/nmah_846148)(only image is used)
All PV-diagrams are made by me using Dia, Geogebra and paint software
Thanks for Reading

Congratulations @amansharma555! You have completed the following achievement on Steemit and have been rewarded with new badge(s) :
Click on the badge to view your Board of Honor.
If you no longer want to receive notifications, reply to this comment with the word
STOPDo not miss the last post from @steemitboard:
SteemitBoard and the Veterans on Steemit - The First Community Badge.
Congratulations @amansharma555! You have completed the following achievement on Steemit and have been rewarded with new badge(s) :
Click on the badge to view your Board of Honor.
If you no longer want to receive notifications, reply to this comment with the word
STOP