INTRODUCTION TO CARTOGRAPHY - COLOR & PATTERN IN SYMBOLISM (Part II)
Hello everyone!
How are you doing today? Hope you're having a great day. I've been extremely busy lately which is the main reason why it took me a week to come back with another engineering blog. I also noticed it's been more than two weeks since my last Cartography blog was uploaded, so I decided I would make the most of my free time during the weekend and share another part of this series with you. I don't mean to waste your time though, so let's do this!
As promised in a previous Cartography post regarding the utilization of color and pattern in the symbolization of qualitative characteristics, this time I'm taking the chance to share some information regarding color and pattern in the symbolization of quantitative characteristics of geographic phenomena and geographic entities. We will discuss broad information regarding Color Sequences, which are tools that are used for the precise depiction of the spatial distribution of geographic phenomena. We will also take a deeper look at some of the most commonly used Color Sequences, so stay focused!
For those of you who have just tuned in, I'd like to inform you that this is an introductory series about the scientific field of creating 2D depictions of our 3D world with precision. This means that we will be discussing general information in a simplified manner. And this is the main reason why there's always a high chance of learning a thing or two by reading through these blogs, so stay tuned!
Color Sequences
In order to achieve precise and efficient depiction of the various classes of quantitative characteristics of the geographic phenomena presented in a projection, Cartographers came up with the idea of utilizing color progressions. These are extremely useful tools of spatial distribution that enable the author(s) to include information regarding the various geographic phenomena and entities at a scale level. However, let's keep in mind that there are standards that have to be met concerning the color progressions used, regardless of the geometry and nature of the geographic phenomena and entities represented or the spatial correlations between those.
The primary concern when designing a color progression should always be enabling observers and users to indentify and match all colors used in the map with the ones demonstrated in the memo board. Furthermore, color progressions are meant to assist Cartographers in projecting the dynamic changes in magnitude of the spatial characteristics of the various geographic phenomena across the entire map surface with efficiency. Moreover, color progressions must always be designed so as to enable users to compare quantitative data regarding geographic entities, gathered from multiple projections of the same area of the Natural Terrestrial Surface.
Those three requirements mentioned above are absolutely necessary and at the same time hard to be met and embodied in a color progression simultaneously. As a result, Cartographers utilize unique combinations of intensity and saturation for each hue and create Color Sequences with values that range between two opposite colors. It is worth noting at this point that there are also cases in which a different approach is taken, where Color Sequences of various hues are used instead. Last but never least, Cartographers usually utilize white to black Color Sequences as well, which are also known as intensity sequences with luminosity values that range from white to black color. Let's take a deeper look at some of the most commonly used Color Sequences.
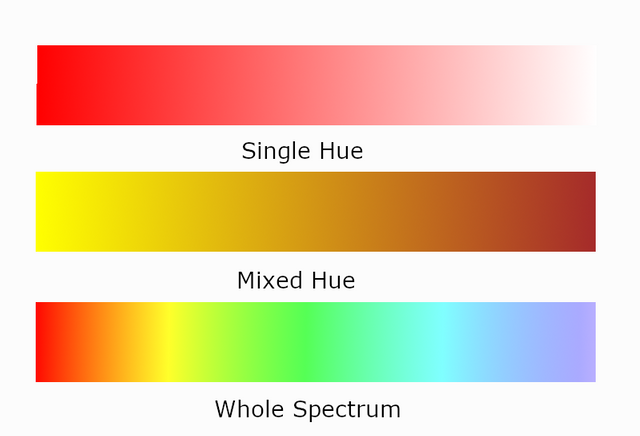
Single Hue Sequences
Single hue sequences are well known for the design patterns followed, which basically result in the systematic reduction of intensity along with the simultaneous increase of saturation as hues range from white color to the original hue that is utilized. This specific type of Color Sequence represents one of the most efficient ways of depicting the spatial distribution of the dynamic changes demonstrated by geographic phenomena. The main reason is the fact that intensity and saturation are fundamental graphical elements. This means these elements are appropriate choices for the transmission of information regarding size to the observer's eye, especially when used in a color progression. We owe this to these attributes' optical connection with the concept of size. Don't let them know I told you.
White to Red Sequences are actually very easy to produce in cases of printed mappings, mainly due to the fact that the only requirement is the availability of tonal grading slides of a single hue. Such Color Sequences are easier to produce on the NCS (Natural Color System), where the whole process is actually only a matter of measuring and registering the tonal grading values along the sides of the chart. However, according to the Munsel System intensity decreases and saturation increases from white to red color. This goes to show that such simultaneous variations in intensity and saturation occur on a systematic basis in Color Sequences and represent a significant tool in cartographic design.
Sequences of Mixed Hues
Sequences of Mixed Hues are another rather useful tool that enables Cartographers to provide users with precise information regarding the spatial distribution of the dynamic changes demonstrated by geographic phenomena. The only restriction in place in this case is that the end product should never be identical with any of the hues included in the visible spectrum. This type of Color Sequences utilizes hues that are mixed uniformly, which basically means that all variations in intensity, saturation and hue occur as part of the same process. And that's the obvious reason why they are named Sequences of Mixed Hues.
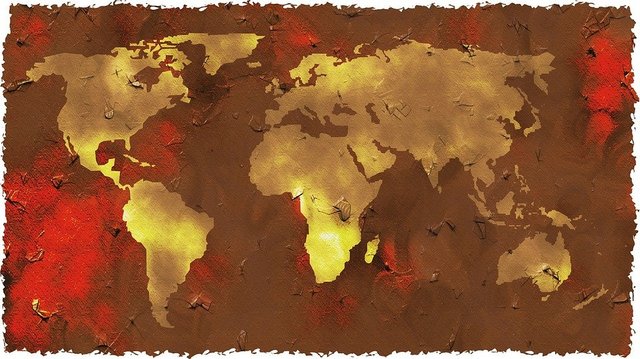
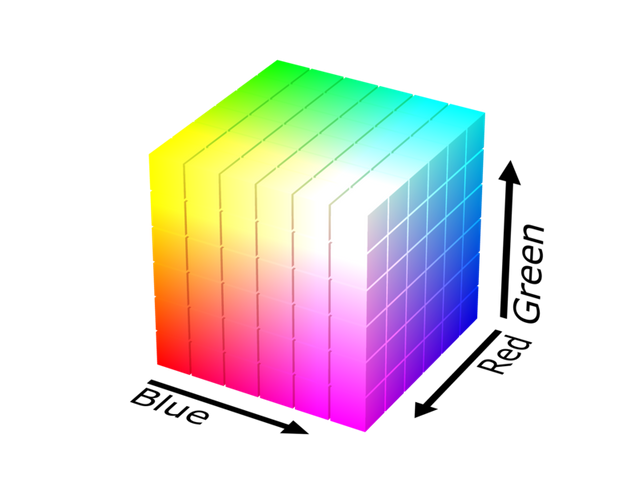
One of the most popular and commonly used Seuqences of Mixed Hues is the Color Sequence from yellow to brown color. This specific type of Color Sequences is mainly used for the precise and efficient depiction of altitudinal variations of parts of the Natural Terrestrial Surface in topographic maps. However it is actually rather difficult to define and specify this Color Sequence mainly due to the fact that brown color is the final hue produced in this case. That is because this hue can also be produced by combining yellow, magenta and black color. This is also the main reason why the process of defining the RGB coordinates for a progression of brown hues is a true challenge for Cartographers, since those hues are actually situated in the interior of the RGB cube.
Whole Spectrum Sequences
Whole Spectrum Sequences are broadly used by Cartographers for the efficient symbolization of quantitative data. The utilization of Color Sequences that include all spectral colors from blue to red color helps observers and users to spot the correlation between the colors used in the map and the categories of geographic phenomena mentioned in the map memo board. Whole Spectrum Sequences have been used for more than a century in the creation of accurate depictions of the Natural Terrestrial Surface as they enable Cartographers to present geographic entities with their actual colors. This type of Color Sequences is also frequently used in maps depicting the temperature of the planet's surface, mainly due to the fact that most people tend to associate red color with heat.
The popularity of Whole Spectrum Sequences is owed to the system's simplicity which provides the observer with the ability to easily define hues and correlate observations made with information provided in the map memo board. However this is basically the only technical advantage of Whole Spectrum Sequences and thus serves as the only reason such Color Sequences are used in the depiction of quantitative data. Besides the precise projection of the dynamic changes in magnitude of the spatial distribution of a phenomenon is our main objective. That said, it is more than obvious that the utilization of Whole Spectrum Sequences affects the map's efficiency and information capacity, due to huge variations in intensity which set limitations regarding the amount of information that can be presented.
Two-Variable Color Sequences
As explained above, Color Sequences were developed in order to assist Cartographers in the depiction of the dynamic changes in magnitude of geographic phenomena. There are many cases in which changes in magnitude regarding two different geographic phenomena are depicted simultaneously. The two different categories of attributes measured are known as data variables. Two-Variable mappings that combined seemingly irrelevant characteristics were first produced in 1971 by the U.S. Census Bureau. One of the most remarkable projects was a color diagram which was designed based on a Whole Spectrum Sequence. However this diagram along with Whole Spectrum Sequences for single variable quantitative data were heavily criticized during that time for aesthetic reasons.
However we are not disappointed by this. We can actually create a simple yet efficient two-variable color diagram by combining two different sequences of tonal grading of a specific hue. This can be accomplished with the utilization of tonal grading slides by following any specifications in place. The use of Two-Variable Color Sequences has made maps a lot more user friendly and provided them with the ability to extract more useful information by just observing. Studies have shown that the creation of an obvious and clear map memo board makes two-variable mappings a lot easier to read and comprehend. Moreover, the utilization of notes that provide explanations regarding the color diagrams and the categories of information presented in the map is another key element that simplifies the process of extracting spatial information for users with no experience.
Alright people, that's it for today! This brings us to the end of the twelfth part of this Introduction to Cartography series. Thank you very much for dropping by and taking the time to read this. Please let me know if you do have any questions in the comments below and I will respond promptly. I would like to let everyone know that I have another Introduction to Geology series going on and I will be uploading more material within the next few days, so follow me in order to not miss out on any of my future blogs. Thank you to everyone for the support. Have a wonderful day and see you around soon.
PREVIOUS PARTS OF THE SERIES:

IMAGE SOURCES:
REFERENCES:
University Textbooks & Course Lectures:
Χαρτογραφία Ι/ Cartography I -TSOULOS(National Technical University of Athens, School of Rural & Surveying Engineering, Course Lecture Notes)
Xαρτογραφία ΙΙ /Cartography II -NAKOS BYRON(National Technical University of Athens, School of Rural & Surveying Engineering, Course Lectures Notes)
Internet Links:

Thank you for your attention!
Hope you enjoyed this post and did learn a thing or two.
Follow me and stay tuned for more engineering blogs.
Highest Regards
@lordneroo
You are really giving the color code a hard time, somehow making use of anything you could make use of :)
Hehe that's what I always do! What a cold read that was!
Thank you so much for passing by and reading @lemouth!
A cold read? By no means (or I didn't get you here).
I use this expression when somebody makes a perfectly accurate remark. So maybe it's my mistake :)
Maybe it is also me who did not understand it ;)
Hi @lordneroo!
Your post was upvoted by utopian.io in cooperation with steemstem - supporting knowledge, innovation and technological advancement on the Steem Blockchain.
Contribute to Open Source with utopian.io
Learn how to contribute on our website and join the new open source economy.
Want to chat? Join the Utopian Community on Discord https://discord.gg/h52nFrV
Thank you for the support! :)
I think I understand the first 3 types of color sequences. How does this look?
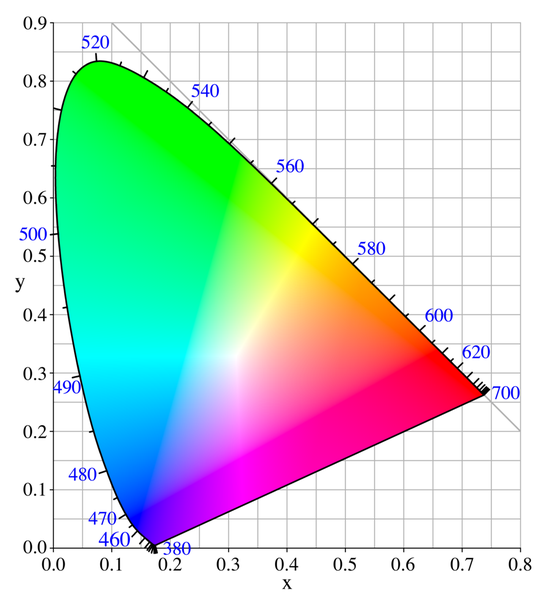
The last one Two-Variable Color Sequences I am not sure I understood. I assume the sequence is a map of colors between 2 points on a CIE gammut diagram like you showed?
Hey @terrylovejoy, you got it absolutely right!
The last one can be easily produced by just utilizing two different sequences of tonal grading of a specific hue. Those two different sequences would serve as our two different variables. I bet you can imagine there can be multiple different combinations as such sequences can be produced by any given hue.
Thank you so much for dropping by! I just saw you uploaded work so I have to read now ;)
Have a good day!
Some people have a natural ability to correlate colors to another code, such as intensity or warmth, or quantities of some kind. Others can't "feel" or "see" that progression from IR to UV as a measuring stick for many illustrations. That's a key illustration of abstract thinking.
Thanks for passing by. Make sure you check the previous parts where I elaborate on intensity, hue and saturation which are the three dimensions of color.
εντάξει! είναι φανταστικός!! για τη νασα έτοιμος!!! καλό βράδυ φιλε...
Xαχα! Θέλω πολλή δουλειά ακόμα για εκεί! Ευχαριστώ για τα καλά σου λόγια Νικ!
STOPThanks ^^
I tried to understand as much as I could, but I think should read from the beginning...
I appreciate the attempt though!
It was hard to understand)
Story of my life :)