Computer Graphing

Graphic computing is the field of visual computing, where visual images are generated systically as for example integrating or changing the visual and spatial information tested in the real world through the use of computers.
A graphic is when there is a trace or mark that has been made intentionally. The graphic, is intended to represent something that is not.
Importance and applications of graphic computing
For several years, computing has accompanied the rest of the branches of knowledge in their evolutionary process, helping to solve problems by facilitating the way to the compression of certain phenomena and streamlining processes that, if not for computers, would consume a considerable time. But not only science, also business, entertainment, advertising, education, industry, among others, have been highly benefited by the collaboration of computing. However, at the beginning this technology was reserved for certain professionals, who based on their knowledge, managed to obtain help from them, making maximum use of their limited resources. Today, computers are present in virtually every place, this is due in large part to the development of computer graphics; This is how the most visited websites are those with a lot of animations and graphics, since they are easier to navigate and pleasant to look at. On the other hand, the highest grossing films are those that have impressive special effects made by computers; In addition, the most popular games are those that have more realistic graphics.
Other applications of graphic computing:
- Interfaces with the user.
- Interactive graphing in business, technology and science.
- Cartography (maps, reliefs, rivers).
- Medicine.
- Sketches and designs assisted by computers, Example: AutoCAD.
- Multimedia Systems (conferences, videophone, distance teaching).
- Simulation for civil and military training.
- Animation of characters for the cinema and television.
Basic Algorithms of Bidimensional Graphs
1. Discretization of lines
- Although the coordinates of the ends of a line are integers, the continuum of infinite points that form the line will be real numbers.
-We want to find representable points on the screen that are on or near the line, which give the best approximation to the real line.
- It is desirable to draw with precision, but much more important is to do it as quickly as possible.
- From the equation of the line, we can calculate points between the ends of a line and draw them on the screen.
- Given a segment according to its extremes (x1, y1) and (x2, y2), the equation of the line that joins them can be written as:

- Assuming that we have a certain putPixel function (...) that allows us to color a pixel on the screen, the C code of this first algorithm could be the following:

- A first defect of this code is that it is only valid if the x coordinate of the first end of the line is smaller than that of the second end.
- Earrings and order of the ends.
- Many algorithms assume that the segment is in the first quadrant.

- Another shortcoming of the previous code is that it only works well with small slopes, since with higher slope lines it leaves undesirable gaps.
- But the main problem is the use of floating point arithmetic, especially the multiplication of the inner loop, very expensive in CPU time.
2. Digital differential analyzer (DDA)
- Basic Incremental Algorithm:
- It is possible to eliminate the multiplication inside the loop if we observe that:

- The C code of this algorithm could be the following:

Examples:
- Draw a line from (1,1) to (6,3):


- Draw a line from (1,1) to (3,6):


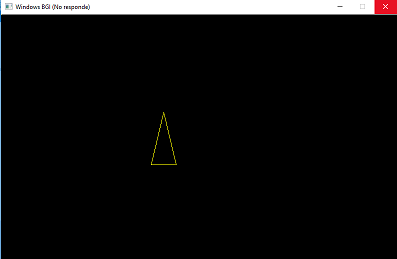
- In this example I will show you the figure of an isosceles triangle made by the DDA lines made in C language by the DevC ++.


 )
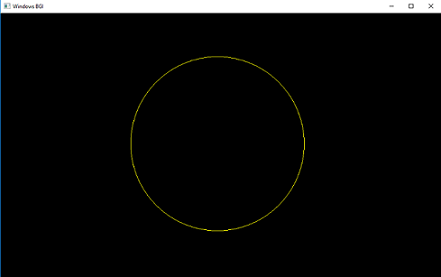
)Discretization of Circumferences
--In a similar way to how we approach the discretization of a line, we will begin by using the equation of the circumference:
- Equation of a circle centered at the origin: x2 + y2 = R2
- Explicit circumference equation:

- It is possible to draw a quarter of a circle by increasing x from 0 to R in unit steps (the other rooms are obtained by symmetry), but large gaps appear when approaching R.
- Parametric equations: x = R·cos θ y = R·sen θ
- We avoid the gaps by increasing the angle θ from 0º to 90º.
Eight-sided symmetry:
- Given a circle centered on the origin and a point on it, we can easily get seven additional points to that.

-Algorithm of the midpoint.
- We consider only 45º of the circumference, the second octant, of x = 0 ax = y = R / √2.
- We will use the function circle_points (...) to complete the rest of the circle.
- The strategy consists of selecting which of two pixels is closest to the circumference, evaluating the function at the midpoint between two pixels.
- In the second octant, the next pixel choice is between pixel E and pixel SE, and it will be based again on a decision variable d:


Example:

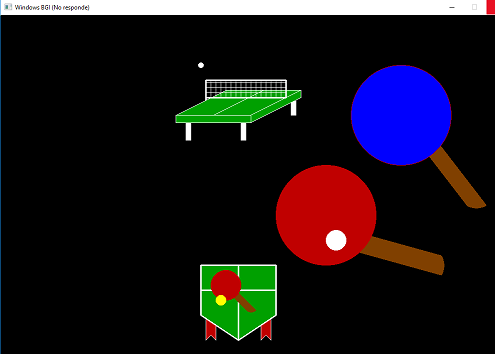
Now I'm going to show you a small drawing in which I use an algorithm to fill in, the DDA lines and the circumferences:

This drawing uses a filling algorithm, which consists in passing the coordinates (x,y) where the painting will start, by parameter, then sending the color to be painted and finally the color of the edge of the figure, what will be the point where you will finish painting. It was done in DevC ++.

- Book: Una Humilde Introducción a la Graficación por Computadora y Otras Yerbas. Eduardo Navas
I hope you enjoyed this content, see you soon.

Computer Graphics is an interesting field.
Yes it is. Thanks for your comment