You are viewing a single comment's thread from:
RE: Phosphorylation promotes binding affinity of Rap-Raf complex [Original Research Work Summary]
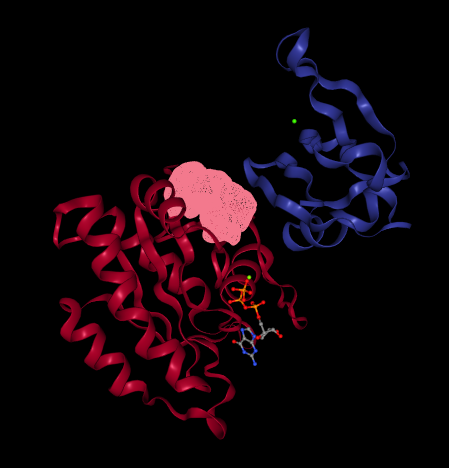
what kind newpocket find in 1c1y?
in this structure there is only this pocket in addition to the pocket with ligand
Okay great question. First of all in our case we analyse the pockets considering Rap chain only. We are not considering Raf chain. Secondly we used CASTp to analyse the highest volume pockets in the Rap chain of 1C1Y Crystal structure, GTP-SER11 simulation averaged structure and GTP-PSER11 case domination averages structure (395 to 400ns). In those structures, we see phosphorylation case ie GTP-PSER11 Rap chain exhibiting a unique pocket location shown in Black in the pocket analysis figure
https://www.nature.com/articles/s41598-018-31234-7/figures/9
for the current model, no matter if there is an additional circuit or not. I can not understand the localization of the pocket in the picture. There is no highlighting of amino acids, and the color range is chosen very poorly. black area is also unclear what it is.
Do you mind looking at the supplementary files of our paper? It has the details.
https://static-content.springer.com/esm/art%3A10.1038%2Fs41598-018-31234-7/MediaObjects/41598_2018_31234_MOESM1_ESM.pdf
See the Table S3