~ (KMX) and (HAWK) Stock / Option Trade Log + Analysis ~ October 13th, 2016 (Exited KMX puts with a +55.56% profit!)
Wednesday September 21st, 2016, CarMax [KMX] reported 'bad' Q2 earnings. KMX released their Q2 earnings prior to the stock market open. This bad news triggered investors to sell their existing positions and or short KMX. The stock dropped more than -3% during pre-market trading in the morning. After the stock market opened and I watched KMX for about 30 minutes, I then decided to buy-to-open a few October 21st 55.00 puts at $2.54 / contract.
The bearish trend continued over the trading week and my puts were already profitable at roughly a +20% unrealized gain (give or take). After holding the puts for a week I was still confident that the bearish trend would resume over the next few days / weeks.
Below are the links to the 1st and 2nd post in this series:
~ CarMax (KMX) Analysis + Option Trade Log 9/29/2016 (Bearish swing on bad Q2 earnings) ~
~ CarMax (KMX) Analysis + Option Trade Log 10/01/2016 (Bearish swing on bad Q2 earnings) ~
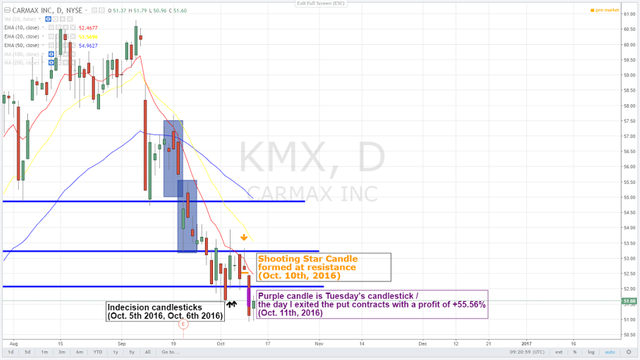
Wednesday Oct. 5th, 2016 KMX bullishly gaped into the 10-EMA (red line on graph) and a resistance / support zone, however, selling pressure caused the stock to form a large indecision candle stick at the end of the trading day. Oct. 5th's daily candle stick had a long upper wick (which indicates selling pressure) that was about 2-3 times longer than the lower wick (which indications buying strength). Based on this bearish sentiment, I decided to add 3 more Oct. 21st 55.00 put contracts to my position at a cheaper price (3 contracts is how much I could afford, ha). I paid $2.35 / contract for these additional contracts. This was a 8.08% discount from the first contracts I paid for at $2.54 / contract.
On October 6th, KMX traded lower and formed a doji candle.
The next day, Oct. 7th, KMX bullishly gaped up into resistance / support then bearishly rolled over and closed below the doji candle formed the prior day. A bearish candlestick with a 'shaved top' formed right at resistance / support (bearish signal) and KMX ended the trading day down -0.85%. This was good sign but KMX's price was still trading within resistance / support and I needed the stock to breakout to the downside in order for the trade to be profitable.
KMX bullishly traded back into resistance / support on both Oct. 6th and Oct. 7th... at this point the put contracts I purchased were down and had negative unrealized gain. My confidence in this trade was hanging on the fact that KMX was still trading within a resistance / support zone and did not completely break out bullish / reverse.
On Monday October 10th, 2016, KMX bullishly gaped and opened with a gain of +0.80%. This definitely upset me (temporarily) because I wanted Friday's candle to confirm that KMX was still trading on the bearish side of the stock market. As I watched KMX in the afternoon on Monday, investors started to sell the stock off and consequently push the stock's price to close below the stock's opening price. As a result of this bearish action, a 'Shooting Star Candle' was formed at resistance / support on the daily chart. This was a very strong sign that the bearish trend would soon resume.
It is safe to say by the end of Monday's trading day, I regained my confidence that I would be able to exit my put contacts with good profit.
Boy...was I correct in being confident!
On Tuesday (Oct. 11th) KMX bearishly gaped down at the open of the trading day and rolled over. KMX ended Tuesday's trading day at $52.64 / share down to $51.14 / share or -2.85% for the day. This was just the type of price drop I needed in order to exit my put contracts with a very good gain.
I purchased the initial set of Oct. 21st 55.00 put contracts at $2.54 / contract and the second set of Oct. 21st 55.00 put contracts at $2.35 / contract. I sold the entire position for $3.9056 / contract or a +55.56% profit!
See the chart below to get a visual representation (The blue lines are support/resistance levels).
-
Blackhawk Network Holdings Inc. (HAWK)
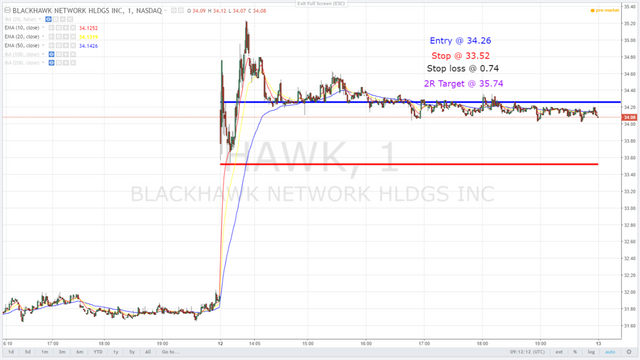
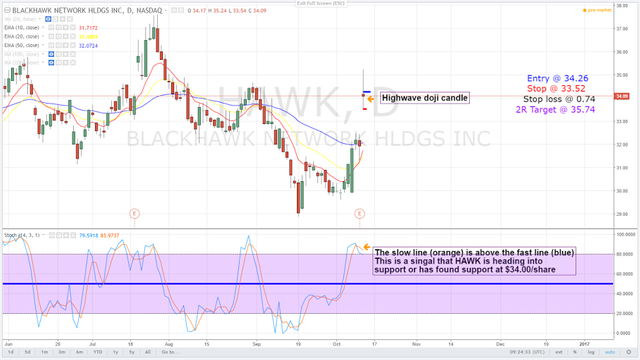
Yesterday (Oct. 12th), Blackhawk Network Holdings Inc. (HAWK) gaped bullishly based on the report of "good" Q3 earnings. I decided to go long HAWK and purchased some stock at $34.26 / share.
Below is a chart of HAWK using a 1-minute time frame and a chart of HAWK on the daily time frame.
HAWK chart (1 minute frame)
HAWK chart (daily time frame)
Stay tuned for updates regarding my trade on HAWK and future trades!
Until next time,
- Ford Mogul
----
Thank you for reading! If you found value in this post and would like to support this blog please up-vote & resteem.
Follow for more great content! (steemit.com/@fordmogul)