Technical Analysis- Introduction for Beginners!
Technical Analysis- What is it?
I would define technical analysis as a short-term price analysis of an investment, based on price changes, volume turnover, book orders and technical indicators.
Technical analysis is used to determine the probable change in prices in the future based on their past evaluation, considering factors that may have an impact on the development of their supply and demand.
Technical analyst would only consider past price movements, disregarding the outside information or fundamental analysis. Basically, people that use technical analysis believe that all the information that is out there is already presented in the price movement.
This may sound disturbing to the early investors, however, the basic assumptions of the technical analysis are that demand and supply decide about security prices. Even the proponents of fundamental analysis can’t argue with this obvious assumption - after all, the law of supply and demand is one of the basic economic laws governing the market.
An investor who conducts technical analysis through skillful purchase and sale can achieve above-average income, which results from the difference in stock prices. This investor would disregard the matter if the company (whose shares he buys) has good prospects for the future. By using this analysis this investor would only generate a signal indicating whether the shares should be bought or sold.
To me a good investor should consider both fundamental and technical analysis of a stock. However, when it comes to commodities or currencies there is not much fundamental analysis to be done. This leaves investors with only one thing that they can rely on, which is the historical price movements.
Another very important assumption about technical analysis is that the current prices or price actions are responding faster than the economic events. Which means that markets are a mechanism that discounts future. Some other assumptions of Technical Analysis are:
- changes in the supply and demand on the market are reflected in stock prices,
- changes in prices are subject to trends that have persisted for a long time
- the processes taking place in the market are repeated.
There are two different ways of conducting your own technical analysis: stock price charts and technical indicators. According to technical analysts, it is possible to indicate certain graphical patterns of stock prices based on the past behavior. They are called technical formations and tend to repeat, which allows forecasting the direction of changes in prices in the near future.
I personally believe that to have a strong determination of future price movement, you have to look at both: trends and indicators.
To really understand TA u need to understand charts!
Let’s talk briefly about trends:
We can have three different trends:
- Longterm trend. This usualy last at least a year
- Midterm trend. Last from few weeks to few months
- Shortterm trends. Lasting only a week or two.
So, how to find a and distinguish a trend?
You will need at least two points on the chart two draw a trend, however, to confirm it you need more points than that. The very basic trends are channels, resistant and support lines.
Let’s consider channels
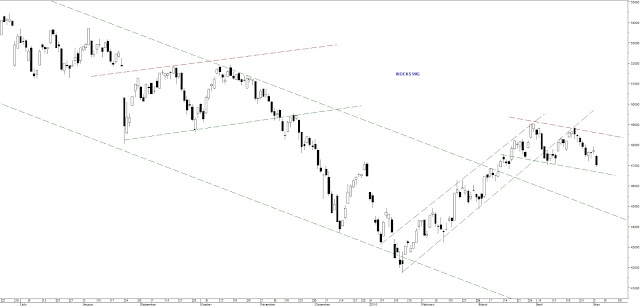
As, you can see, from time to time, stock or currency prices can move in the channel. By spotting and confirming a channel, investors can easily capitalize by buying at the bottom of a channel and selling at the top of the channel. The resulting profits are low, however risk of this investment is low as well. You can distinguish long- or short-term channels and base you strategy on that. Breaking beyond the channel is also a good indicator too.
Let’s consider resistance and support lines:
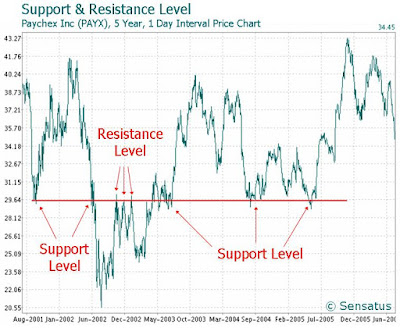
You can see that support levels are usually a bottom prices of the last bear run (price decrease), resistance on the other hand are the levels of the last bull run (price increase). Most likely a previous resistance level becomes a new support level. By looking at those level, investors can easily determine when to buy or sell a particular security. You would simply buy at the support levels and sell and the resistance levels to profit.
The other important trend indicators are:
- Head and shoulders formation
- Invert head and shoulders
- Double top or bottom formation
- Cup and handle formation
- Triangles
- Diamond formation
- Flags
- Wedges
- Rectangular Pattern
- V-Shape Pattern
- Fibonacci Levels
Technical Indicators
The other important tool in technical analysis are indicators. We have variety of those, and each investors have their own favorite. Main favorites are:
- RSI
- ROC
- OBV and Volume
- Stochastic Oscillator
- MACD
- Moving averages
- Bollinger Bands
- CCI
Candle Sticks
The final thing for the investors using technical analysis is to understand candle sticks on the charts. They graphically present the situation of supply and demand, showing who wins the "bull" fight with the "bear".
Japanese candles are one of the oldest methods for analyzing charts. The appearance of candles are for many professional investors a basic analytical workshop.
Four elements are needed to build a candle:
- opening price from the audited period,
- closing price from the audited period,
- the lowest price from the examined period,
- the highest price from the period under examination.

Follow me and upvote for more great content like this!
Check out my IG: @crypto.ghost
Also, if you want me to produce more valuable content, you can buy me a cup of coffee!
Just "click" on the image!
nice content :)
Thank you!
no problem i am new here :)