Awesome web dev tutorial: Plotting NASA and SpaceX facilities on a Mapbox map using React and Leaflet.js
https://github.com/Nicknyr/NASA-Space_Steemit_Tutorial
Fun with NASA and SpaceX APIs!
Plotting SpaceX and NASA locations on a map using React, Mapbox, and Leaflet

The advent of SpaceX and it’s recent successful launches of the Falcon Heavy rocket has created a media buzz and drawn the public’s eye back to space exploration. There has been a newfound resurgence of excitement pertaining to space travel and in this project I am going to teach you how to use React, Mapbox, and Leaflet as well as the unofficial SpaceX API and the official NASA API to plot both SpaceX and NASA facilities and launchpads on a map. This project is a good starting point for people interested in learning more about React and Mapbox. An understanding of Javascript fundamentals is recommended before diving into this.
Check out the finished project here
What you will learn:
- How to make requests to the NASA and SpaceX APIs
- Setting up a Mapbox map
- Using React-Leaflet to display the map in a React project

Requirements:
The project will use the following technologies:
Difficulty:
Intermediate
React-create-app is the easiest way to get started with a React project and takes care of all of the configuration we need for this project. To get started with React-create-app open the terminal and issue the following commands:
npx create-react-app my-app
cd my-app
This creates our project directory, takes care of configuration, and then navigates to the directory. After getting React-create-app set up and ready to go we need to install the dependencies for the packages we are going to use. We will be using Node package manager (npm) to install these packages. Issue the following commands to install React-Leaflet, Axios, and Leaflet.
npm i react-leaflet
npm i axios
npm i leaflet
This will install the proper dependencies and these packages will be added to our project’s package.json file. We now have access to these packages and can use them in our project.
After opening our project in Atom (or whichever text editor you prefer) we will need to navigate to the src folder and create a Map.js file where we will build our Mapbox component. In order to use Axios, React-leaflet, and Leaflet we will need to import the following:
import React, { Component } from 'react';
import { Map, TileLayer, Marker, Popup } from 'react-leaflet';
import axios from 'axios';
We will be using an ES6 class in our component because it will require state. Our Map.js component will start out like this:
class Mapbox extends Component {
  constructor(props){
    super(props);
    this.state = {
    }
  }

render() {

  return (

      );
    }
  }

  export default Mapbox;
The next step is to save the API URLs to variables so we can use them without typing out the entire URL every time we reference them:
const url = 'https://api.spacexdata.com/v2/launchpads';
const nasaURL = 'https://data.nasa.gov/resource/gvk9-iz74.json';
const leafURL = 'Set this variable equal to your Mapbox token URL';
Note: You will need to visit Mapbox's website and apply for an API key to follow along
The next step is to initialize the state of our Map.js so we can later save the appropriate data and access it within the component. Let’s start by saving the latitude and longitude of where we want our Mapbox map to focus in on when the map is displayed. Considering that almost all of the facilities we are going to be mapping are in the continental U.S. it makes sense to set our starting point somewhere in the US. I’ve decided to use New York as the starting point. We will create a latlng object within our this.state object, as well as empty arrays to store the SpaceX and NASA API data like so:
this.state = {
        latlng: {
        lat: 28.5618571,
        lng: -80.577366,
        },
        spacexData: [],
        nasaData: [],

   }
After setting up our initial state within our component we need to use a React lifecycle method to make the API calls via an Axios call. We will be using componentDidMount to make our Axios calls like this:
componentDidMount() {
    axios.get(url)
      .then(res => {
        this.setState({spacexData: res.data})
      })
      .catch(err => {
      console.log('Error retrieving SpaceX data');
    })

    axios.get(nasaURL)
      .then(res => {
        this.setState({nasaData: res.data})
        console.log(this.state.nasaData);
      })
      .catch(err => {
        console.log('Error retrieving NASA data');
      })

  }
When the component mounts the method will make two Axios calls, one for each API. Axios makes the call to the API and returns a Javascript promise that contains the data. The common pattern you will see when using Axios to make an API call looks like this:
axios.get(the URL you are sending the request to)
    .then(res => {
       this.setState({//name of state property: res.data})
    })
This sends out the Axios request and then saves the API data to the component’s state. In our Map.js component we will be making two Axios requests, one for the SpaceX API and one for the NASA API.
In our render method inside the Map.js component we will need to create two constants; one for each of the NASA/SpaceX arrays within our state that contain the data for the facilities. Like so:
const {spacexData} = this.state;
const {nasaData} = this.state;
Later in our return method we will be accessing this data and displaying it with some of the built in functionality that React-Leaflet provides.
Our return method in our component will look like this:
return (
      <div>
        <Map
          style={{height: "100vh"}}
          center={this.state.latlng}
          zoom={2}>
        <TileLayer
          url={leafURL}
          attribution="<attribution>" />

          // Renders SpaceX Facilities on map
          {spacexData.map((elem, i) => {
            return (
              <Marker
                key={i}
                position={{lat:elem.location.latitude, lng: elem.location.longitude}}
                icon={ icon }>
              <Popup>
                <span>
                  <img src={require('./images/NASA.png')} alt="nasa logo"/><br />
                  <h4>{elem.full_name}</h4>
                  <h5>Location:</h5><span>{elem.location.name}, {elem.location.region}</span>
                  <h5>Status:</h5><span>{elem.status}</span><br />
                  <h5>Details:</h5><span>{elem.details}</span><br />
                </span>
                </Popup>
              </Marker>
                )
              })}

              // Renders NASA facilities on map
              {nasaData.map((elem, i) => {
                return (
                  <Marker
                    key={i}
                    position={{lat:elem.location.latitude, lng: elem.location.longitude}}
                    icon={ icon }>
                  <Popup>
                    <span>
                      <img src={require('./images/spacex-small.png')} width="150px" alt="spacex logo"/><br />
                      <h4>{elem.center}</h4>
                      <h5>Location:</h5><span>{elem.city}, {elem.state}</span><br />
                      <h5>Status:</h5><span>{elem.occupied}</span><br />
                      <h5>Details:</h5><span>{elem.facility}</span>
                    </span>
                  </Popup>
                  </Marker>
                )
              })}
            </Map>
          </div>
        );
Let’s break this down piece by piece so that we understand how it works:
React-Leaflet provides us with their version of Leaflet’s Map component. All of the data and elements used for our map are nested within this component. Let’s look at the first piece of the Map component:
  style={{height: "100vh"}}
          center={this.state.latlng}
          zoom={2}>
        <TileLayer
          url={leafURL}
          attribution="<attribution>" />
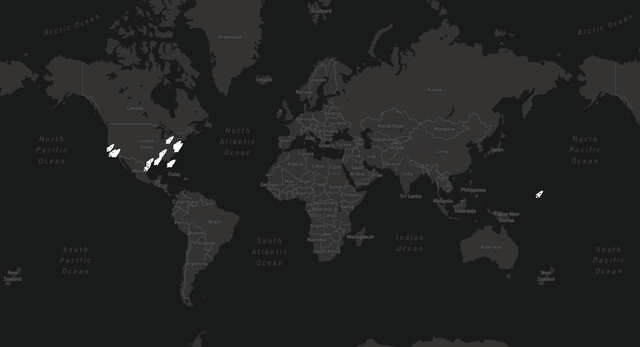
The style attribute contains the height property, the center property, and the zoom level. We will set our height to 100vh, or in other words, 100% of the view port. This is a responsive friendly way to make sure our Map takes up 100% of the screen regardless of what device we view it on. The center property allows us to center our map wherever we want. We will set this equal to this.state.latlng so that our map is centered around the coordinates of New York. Last but not least we have the zoom property. The zoom property does exactly what you think it does. It sets the zoom level for the map. I am setting this to zoom level 2 but you can feel free to experiment with the zoom level by incrementing the number to zoom in or by decrementing the number to 1 to zoom further out.
The TileLayer component is React-Leaflet’s version of Leaflets tile layer and is used to load and display the tiles of our map. We will set this equal to the leafURL variable we created earlier. This loads Mapbox’s dark world map.
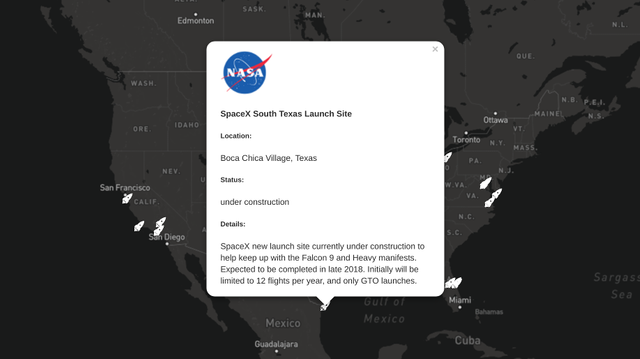
The final parts of our component involve accessing the data we pulled in from the APIs and using Javascript’s map function to iterating through the data and display it on the map. We will do this once for each API. Each use of the map function to iterate and display the data will contain a React-Leaflet Marker to add an image on the location of each facility and a React-Leaflet pop up to display data from the API about each facility when the user click the marker for that facility.
{spacexData.map((elem, i) => {
            return (
              <Marker
                key={i}
                position={{lat:elem.location.latitude, lng: elem.location.longitude}}
                icon={ icon }>
              <Popup>
                <span>
                  <img src={require('./images/NASA.png')} alt="nasa logo"/><br />
                  <h4>{elem.full_name}</h4>
                  <h5>Location:</h5><span>{elem.location.name}, {elem.location.region}</span>
                  <h5>Status:</h5><span>{elem.status}</span><br />
                  <h5>Details:</h5><span>{elem.details}</span><br />
                </span>
                </Popup>
              </Marker>
                )
              })}
The marker component plots each location on the map. It consists of a key property that helps React iterating using the map function, the position on the map where the marker needs to go, and the icon we wish to plot at that location. React will display a warning if we attempt to map over data and don’t provide it with a key. The convention is to set the key to be an index given to the function as a parameter, in our case the ‘i’ parameter we are passing to the spaceX.data.map function. Position will be set to elem.location.latitude and elem.location.longitude. These coordinates are provided to use by the API itself. For the icon property we will be creating a constant in another file in which we load and configure the icon and then load it into the Map.js function via importing.
To make an icon to display as our marker we will create another file called Icon.js and it will look like this:
import L from 'leaflet';

const icon = new L.Icon({
  iconUrl: require('./images/rocket.png'),
  iconRetinaUrl: require('./images/rocket.png'),
  iconAnchor: null,
  shadowUrl: null,
  shadowSize: null,
  shadowAnchor: null,
  iconSize: new L.Point(20, 20),
  className: 'leaflet-div-icon'
});

export { icon };
We are importing L from Leaflet so that we have access to Leaflet’s functionality. Then we load in the image we want, choose a size, and give it a class name so we can style the image using CSS. In our App.css file we will style the icon like so:
.leaflet-div-icon {
  background-color: transparent;
  border: none;
}
The images used in this project can be found in the Github repo
The last part of our Map.js component is creating a Popup component with a span tag nested within it to display the text information about each location provided to us by the APIs. Inside this element we will import an image to display within the popup, the name and region of the facility, the status of the facility, and the details pertaining to the facility.

Our Map.js component and our Icon.js component are now done and we can import the Map component in our App.js file and display it:
import React, { Component } from 'react';
import './App.css';
import Mapbox from './Map.js';

class App extends Component {
  render() {
    return (
      <div className="App">
        <Mapbox />
      </div>
    );
  }
}

export default App;
At this point we can run the app with npm start and display the map. However, after doing so you’ll notice that the map is choppy and is missing tiles. To fix this add the following scripts to the head of your index.html file:
<link rel="stylesheet" href="https://unpkg.com/[email protected]/dist/leaflet.css"
    integrity="sha512-Rksm5RenBEKSKFjgI3a41vrjkw4EVPlJ3+OiI65vTjIdo9brlAacEuKOiQ5OFh7cOI1bkDwLqdLw3Zg0cRJAAQ=="
    crossorigin="" />

<script src="https://unpkg.com/[email protected]/dist/leaflet.js" integrity="sha512-/Nsx9X4HebavoBvEBuyp3I7od5tA0UzAxs+j83KgC8PU0kgB4XiK4Lfe4y4cgBtaRJQEIFCW+oC506aPT2L1zw==" crossorigin="">
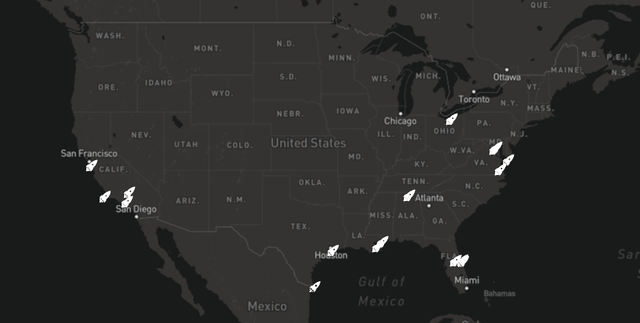
This should fix the display issues the map is having and our project should display just fine. Hopefully when you zoom in on the good ol' US of A it looks something like this:

Not bad for my first tutorial on Steemit, huh?
Please feel free to critique this tutorial and give pointers on how I can make my tutorials better and let me know if you run into any issues following along. The code in it's entirety can be found here.

Thank you for a beautiful tutorial!
As a fan of spaceX, I enjoyed your tutorial and the cool idea behind it :)
Few suggestions for your future work:
And finally, welcome to steemit/utopian ! :)
Your contribution has been evaluated according to Utopian policies and guidelines, as well as a predefined set of questions pertaining to the category.
To view those questions and the relevant answers related to your post, click here.
Need help? Write a ticket on https://support.utopian.io/.
Chat with us on Discord.
[utopian-moderator]
Thanks for your help and for the the feedback.
Hey @nicknyr
Thanks for contributing on Utopian.
Congratulations! Your contribution was Staff Picked to receive a maximum vote for the tutorials category on Utopian for being of significant value to the project and the open source community.
We’re already looking forward to your next contribution!
Contributing on Utopian
Learn how to contribute on our website or by watching this tutorial on Youtube.
Want to chat? Join us on Discord https://discord.gg/h52nFrV.
Vote for Utopian Witness!