Bitcoin Update: The Bears Strike Back

In my last update, we discussed a bull flag and double top pattern that had formed. While there was a chance for a bullish break, the signs of weakness were impossible to ignore. I hope everyone prepared their portfolios accordingly. I mentioned that if bitcoin broke below the bear flag, it may be a good time to enter a short position. If you took advantage of that, CONGRATULATIONS. If not, don't worry...hindsight is always 20/20. There will be plenty of opportunity moving forward.
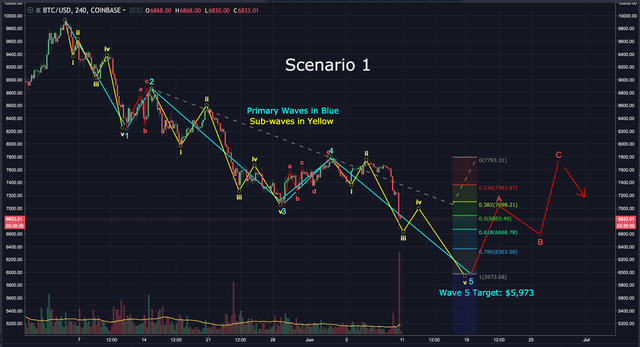
Bitcoin looks to be in the bearish scenario I've been warning about for the last 2 weeks. If correct, it's currently in it's fifth wave down, with a logical target of $5,973 (1.0 fib level). I've highlighted the sub-waves in yellow.

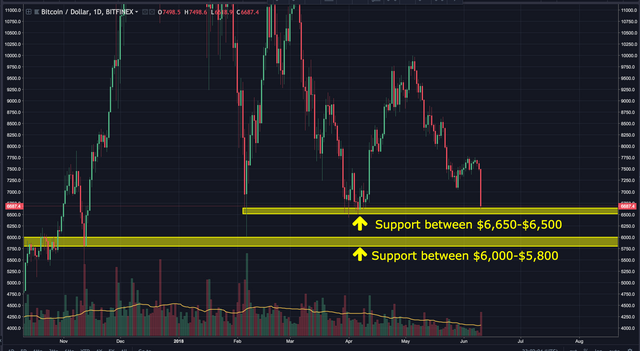
I do have an alternate count that should be considered. There's a strong area of support between $6,650 and $6,500. Below that, there's support between $6,000 and $5,800.
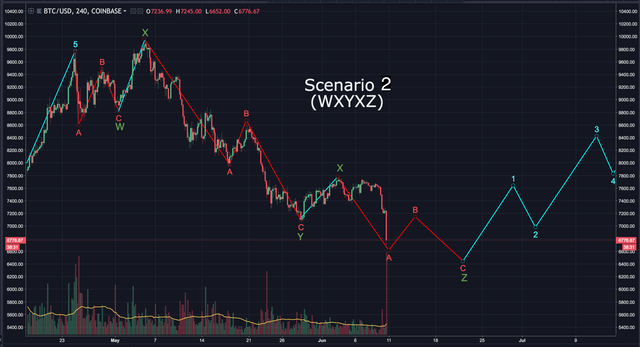
If the bulls are able to prevent bitcoin from breaking below the first support zone, we may be in a WXYXZ pattern. If you're unfamiliar, a WXYXZ pattern connects 3 ABC corrective patterns. If this count is correct, bitcoin had a second wave failure (denoted by X), and is currently in wave A of its third ABC correction. Here's how this count may play out:
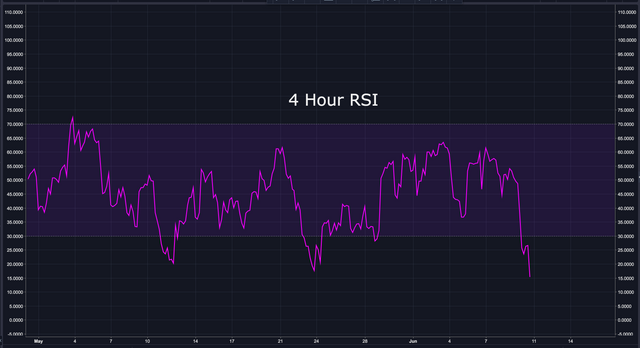
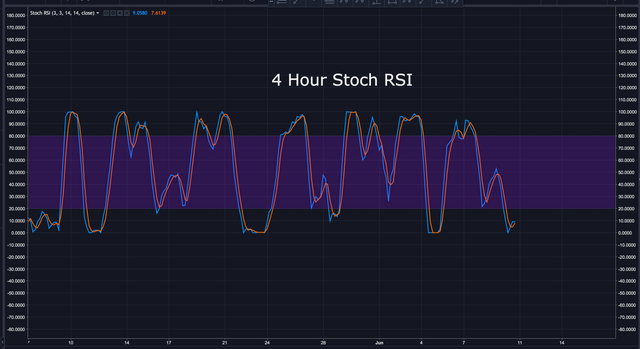
The 4 hour RSI is extremely oversold. This suggests wave 3 is nearing completion.
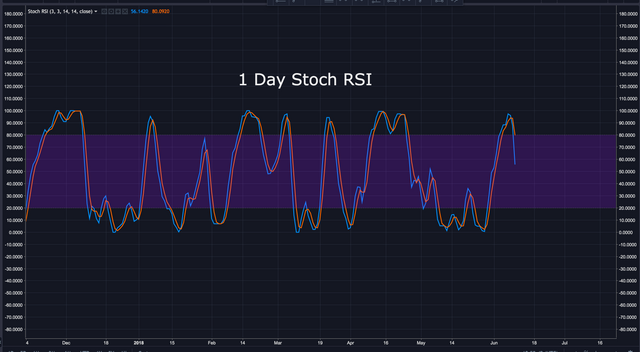
The stoch RSI is oversold on the 4 hour chart, but overbought on the daily. This suggests we may see a temporary rise, but there's still more downside to come. This is in line with both scenarios listed above.
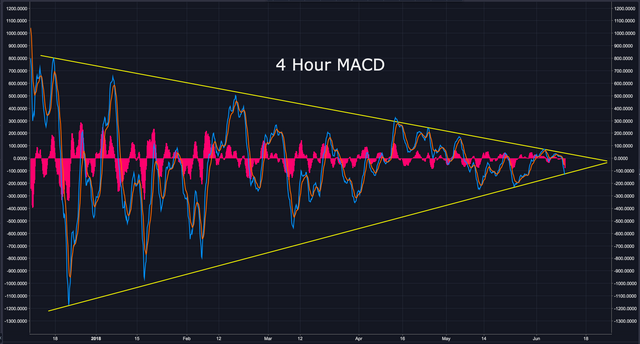
Bitcoin is still operating within the wedge I've been discussing on the 4 hour MACD. As it moves towards the apex, we can expect a major move up or down within the next week.
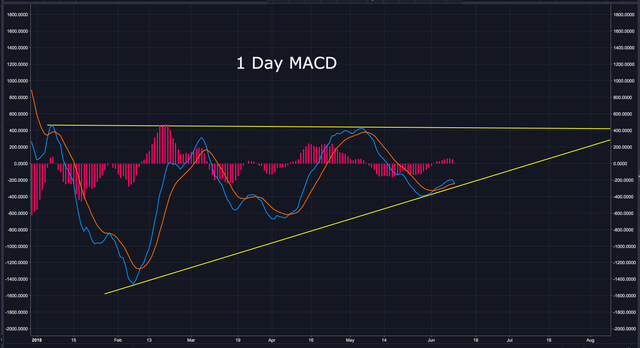
The 1 day MACD is also forming a tighter pattern within a wedge. This also suggests a major move is looming.
Keep an eye on the support zones. A break below $6,500 may be a good entry point for a short targeting $$6,000. Conversely, a strong bounce off the support zone may be a good time to enter a quick trade targeting $7,000. This is just my opinion, not financial advice. Only you can decide how much risk you're comfortable taking. Often times, doing nothing is the best option.
This week should be very telling for bitcoin. Let's see how it plays out.
BIAS:
Short Term: Neutral to Bearish
Longterm: Very Bullish
I hope this has been helpful. I’d be happy to answer any questions in the comment section below. Thanks for stopping by.
If you found this post informative, please:

If you don’t have an account on Binance, I STRONGLY recommend getting one. They’re usually the first to get reputable coins, have excellent security and second to none customer service. You can sign up here free of charge: https://www.binance.com/?ref=16878853
FYI…I just started a Facebook and twitter page where I’ll post analysis, along with other relevant crypto data from myself and others. If you’d like to be notified as soon as updates reach Steemit, the twitter handle is @Workin2005 and the Facebook page is https://www.facebook.com/Workin2005/
Published on

by Workin2005


Nice work man, some of the most realistic TA I've seen around (in spite of my hate of Elliott waves!)
Thanks @bitbrian. Haha....yea, Elliot wave is a great tool, but it's certainly not the only tool. It works best when there's an established trend.