Elliott Wave Theory for Predicting the Market’s Trend — A Simple Guide

In 1930, Ralph Nelson Elliott invented the wave theory model to predict the market status while market shows instability. Sudden up and down leads to wave patterns and when this wave hits in the cryptocurrency market, then Elliott wave theory helps to predict the market flow. The prediction cannot set the future value of the market however it could predict whether the market will rise or go down. The wave pattern like up-down-up-down-up lead to Elliott wave theory.
Elliott Wave Theory is designed to resolve the market status by analyzing a technical method for the long-term. With an iterative price movement, the investor could predict the market’s changing pattern. As you can assume the fraction of time between two waves standing on the beach the Elliott wave theory works similar to it. The principle considers waves as waves that create a standard and solution that contradict the bigger phenomenon.
Many technologist researchers use the Elliott Wave hypothesis to take advantage of wave patterns on the stock market. This theory indicates stock price fluctuations could be forecast by repeated up-and-down cycles known as waves that come from the psychology of investors.
Dow Theory and Elliott wave theory almost follow a similar pattern to study however Elliott wave theory draws an intense analysis of the market. The deeper study and explanation is sufficient for calculating the market’s movement following the wavy price fluctuation graph.
In Elliott’s theory, three types of motive waves, corrective waves, and impulses were studied, in particular. It applies, and all traders view the principle equally. It is not a successful business practice. The idea of wave analysis does not consist in a regular blueprint training itself, where you simply comply with the instructions, as opposed to other prize courses. Wave research provides insight into global patterns and lets you develop a much deeper understanding of price changes.
Most of the two wave pattern is really popular in traders and investors to speculate the price movement. Impulse waves and corrective waves are the core patterns to study in Elliott’s wave theory.
Impulse waves constructed through the five waves that show the fluctuation in price movement and allow net movement the same way as the next-largest pattern. For the impulse, wave patterns require hours of study and it doesn’t limit for a certain time. It also runs in the same direction to a larger degree. Five wave impulse theory indicates the bull market.
Having three sub-wave corrective waves go against the trend to on a larger-degree. Is basically indicates the bear market status and go downtrends and lead the market to a positive trend. Corrective waves studied through the diagonal pattern.
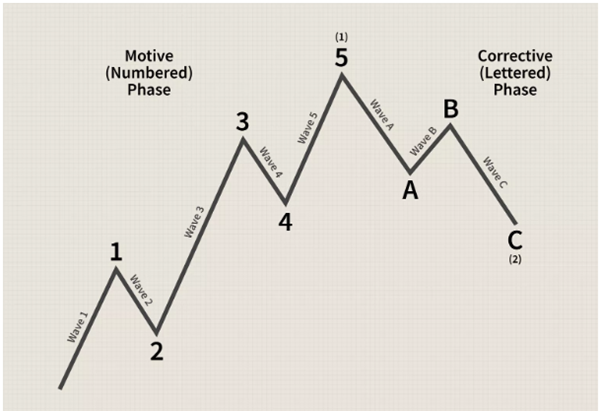
Traders think that the upward and downward developments in the market all follow Elliott Wave’s principle, which implies price movements in the market. In Elliott wave theory, the market is either downtrend or uptrend, but in both cases, the market will only follow a ratio of 5:3. If you calculate any trend, it should not be more than 5 and corrective waves will occur after the fifth wave market. In the diagram above, waves 1, 3 and 5 are impulse waves where waves 2 and 4 are corrective waves. The first five waves indicate the growth in the market, while the trend is revised with the waves A, B, and C. For waves 1, 2, 3, 4, and 5, if the price meets the same momentum, then you can claim market fits wave theory of Elliott.
You should be aware that each theory follows certain conditions to provide a better explanation of their characteristics. There are also conditions in Elliott’s wave theory, and violation of the theory is not acceptable.
The image shows uptrend of the market by wave theory from Elliott. The first wave indicates the price up while the number 2 of wave demonstrates the market correction. Now, you must understand that wave 2 should not violate 100% of wave 1 if the market follows Elliott’s theory. Through observing pattern waves 3 and 4, respectively, wave 4 does not approach or dip below the highest price point of wave 1. Wave 5 will also increase the market’s price but will correct somewhat after the long rise market. Three remedial waves play here the correction of the market. Wave A, B, and C are the correction wave contributing to a downward trend in the market. The Elliott Wave theory says that if the demand is upstream the three correction waves will never be less than the peak 4 (displayed in the picture).
You have therefore properly understood the principle to forecast the state of the economy by research. Elliott wave theory is the best method for predicting and trading the market trend. Nearly all traders worldwide follow this technical analysis of the market trend via the Elliott wave theory.
https://www.coinbreze.com/
Telegram: https://t.me/coinbreze
Twitter: https://twitter.com/coinbreze
Facebook: https://www.facebook.com/Coinbreze
Congratulations @coinbreze! You have completed the following achievement on the Steem blockchain and have been rewarded with new badge(s) :
You can view your badges on your Steem Board and compare to others on the Steem Ranking
If you no longer want to receive notifications, reply to this comment with the word
STOPTo support your work, I also upvoted your post!
Vote for @Steemitboard as a witness to get one more award and increased upvotes!