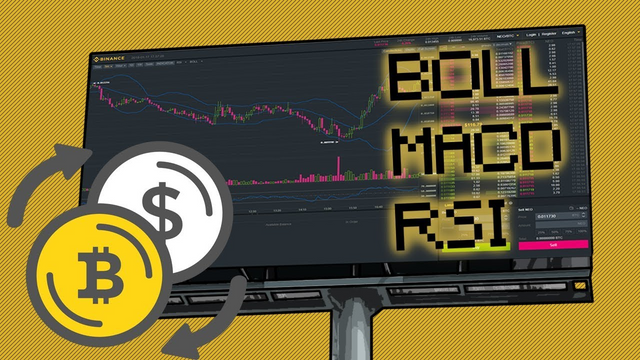
Bollinger Band MACD and RSI Trading Strategy
Bollinger Band MACD and RSI Trading Strategy
1. So first, is any strategy fail-proof?
No it isn't, and if you believe that, this is not the article for you, just like everything, it can fail, and trading is no different. No matter how many indicators you use, no matter how many news articles came about the currency your trading, what people are saying on twitter about it, or whoever supports that currency, it can either go down or up and NO ONE knows where it is going.
2. So, why should you use any strategy if it is not going to guarantee success?
Trading strategies as I have said are not a way to guarantee you success but a way to minimize your risk and maximize your profit, it will never be 100% certain you will come on top of a trade, we are just trying to lower our chances to fail.
Also, this might be one of the best strategies to learn when you're beginning to trade, it requires training like everything but its pretty easy learn and master.
3. What Indicators are we going to use?
First I want to say you can use this strategy for either going short or going long, but I will explain as if we were going long since that is the most common case for beginners and this is a beginners guide.
So we are going to use 3 different indicators, our main indicator will be:
- Bollinger Bands (BB)
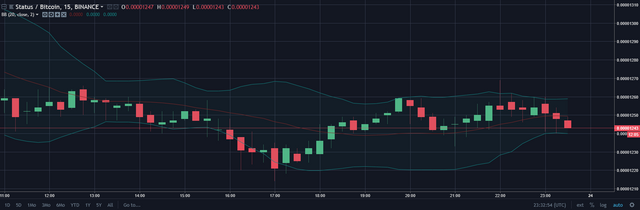
So when it comes to the BBs our focus will be the 3 lines, and those 3 lines, the top, middle and bottom, which will all work as either support or resistance lines. The lines ABOVE the candlesticks will work as resistance (the lines we want to break through) and the lines BELOW will work as support.
- Moving Average Convergence Divergence (MACD)
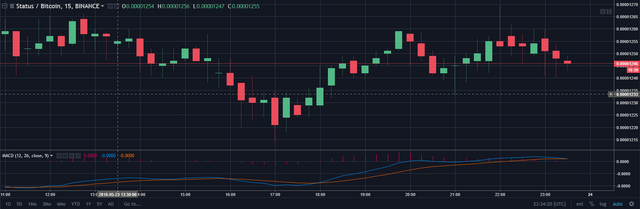
Now, MACD will provide us info on where the volume is going and how the market is performing, either is in a sell-off point or people are buying in, and what we will be looking for is for the crossing between the 2 lines, or the moments when the bars change side. Depending on how the lines cross and how the bars change side, is either our buy in points or our sell points.
- Relative Strength Index (RSI)
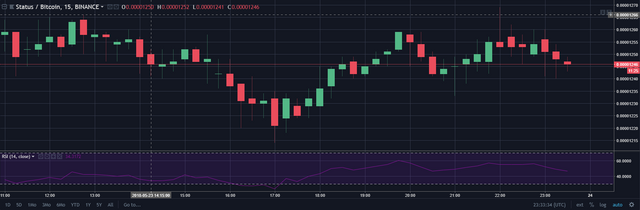
With the RSI, the info we are getting from it is the momentum in the market, and whether it is oversold or overbought, and thats also when we are going to either buy-in or sell-off.
This 3 will be our focus! And our best friends for the time being.
So what are we looking for?
For our buy-in, we are looking for something like this:
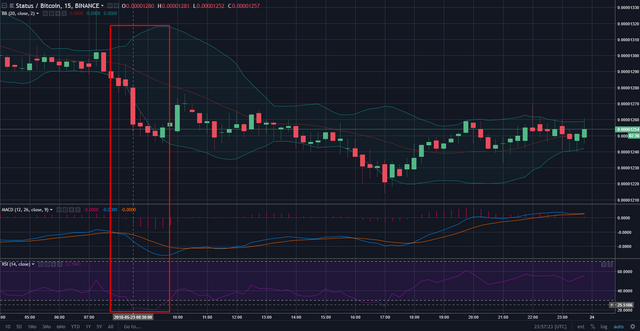
We are looking for the alignment of our 3 Indicators, and let me explain why, if our candlesticks are below the bottom BB it means we are at our support, which means the chance of it going up is high, and using the MACD and RSI as predictive indicators, to predict when this is going to happen, we are looking for MACD and RSI to show us that the market is overbought and that people are starting to sell-off so we can predict the "bottom-touch".
For our sell-off, we are looking for something like this:
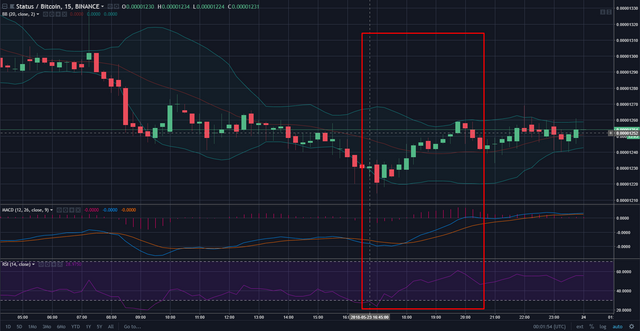
We are still looking at the alignment of our 3 Indicators, but in a different way, so now what we want is for the market to be close to its resistance lines, and this would either be the middle BB or the top BB, and we want the market to start being oversold and at a buy-in point which we will be able to read and predict through the values of MACD and RSI.
Some tips, and tricks:
Now as I said, this will not guarantee you anything, but when you start to get more comfortable with trading overall, you can start looking at new indicators and adding indicators to your strategy and look around, investigate and tweak the strategies you find that suit you to your liking. Every trader as its gut and its strategy, you just need to find yours.
You can also tweak the 3 Indicators here to your liking, and adapt them to new strategies.
When I'm looking for a buy-in point, I'm always looking at the chart and trying to predict where it will it the bottom BB for a chance of shooting up, and I look for values:
- Below 0.01 for MACD Level
- Below 30 for RSI
For sell-off points it really depends on how you trade and how aggressive or passive you are, and what % of profit you are looking for in each trade.
Of course this values are not magic values, its the values I feel comfortable trading with, and you should customize it the way you like it.
When it comes to exchanges, if you are looking for a simple UI and low fees go for Binance.
When it comes to trading windows/time frames, I prefer scalp-trading so I try to keep an eye on low time frames between 3-15 mins, but you can use this strategy for any time frame that suits you, keeping in mind that changing the time frames affects how long your trade can take from opening to close.
If you enjoyed please follow, upvote and resteem.
My next post might be about how to setup your own Trading View screener for this own strategy to get alerts on possible trades.
Very interesting! I found this on reddit. Thanks for your contribution.
Glad you found it useful!
Posted using Partiko Android
Thank you for sharing this dude, I am now following you.. got this from reddit.
Thanks a lot. I will try to keep posting quality content!
Nice Stuff...
Nice content thanks https://9blz.com/bollinger-bands-indicator-explained/