Understanding Triangles : Cryptocurrency Technical Analysis for Beginners!

Introduction
Technical Analysis or TA for short is the practice of analysing graphs that are influenced by demand and supply principles. TA doesn't predict the future of a stock or a crypto coin, it rather gives us indication of how the price is going to move. TA is the universal language amongst traders and that is good news to us. The traders will see certain formations and will plan their strategy accordingly. We can play along and take profit or even understand good points to buy / sell.
Understanding Candlestick Charts
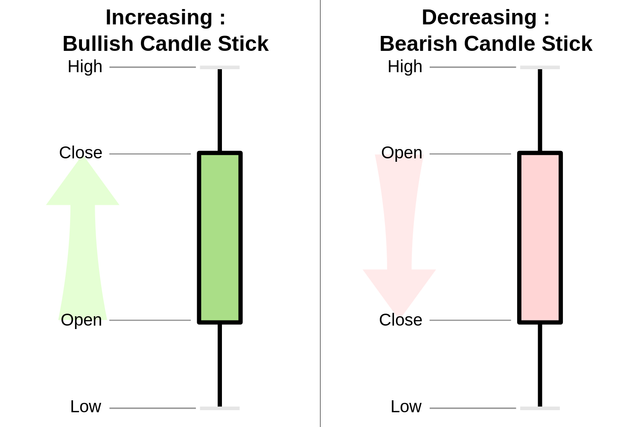
We have two types of candlesticks, Green and Red :
A green candle's closing price is higher than the open price.
A red candle's closing price is lower than the open price.
To make things simple, the green candle represents higher price action and the red lower price action. The wicks of the candle shows us the upper and lower limits that the price reached before the candle was closed. 
Support & Resistance
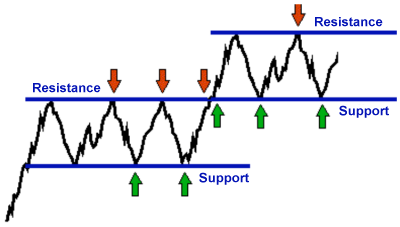
Resistance and Support lines gives us information about how the price is going to move in particular points. Let's define them :
A line where the candles touch repeatedly and bounce back up while the price was decreasing is called support.
A line where the candles touch repeatedly and cannot be breached while the price was increasing is called resistance.
Support and resistance have an inverse relation between them. If a resistance line is breached, it now acts as support and vice versa. In graphs we tend to see these trend lines form around round numbers. Fully understand those two concepts since they are detrimental to Technical Analysis.

Triangles Everywhere
After explaining some basic notions of TA, we are finally getting into the main topic.
Descending triangle
A descending triangle is formed with a flat bottom support line and a decreasing resistance line. It usually indicates a decreasing price action in the market where the price hits lower and lower price points until it finds a good level of support.
Ascending triangle
An ascending triangle is formed with a flat top resistance line and an increasing support line. It usually indicates an increasing price action in the market where the price hits higher and higher price points until it finds a good level of resistance.

Symmetrical triangle
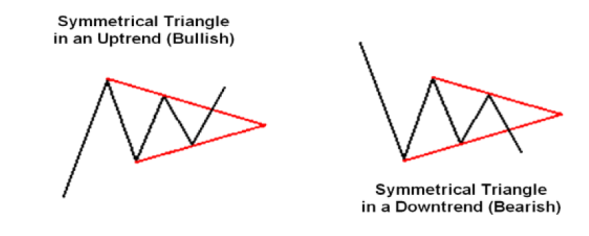
As you have seen before there is yet again an inverse relationship between ascending and descending triangles. Symmetrical triangles flags have two converging lines that act as support and resistance. The symmetrical triangle will indicate a significant price change at the convergence point. Depending on where the triangle is positioned in the chart, different outcomes can be prominent.

Note that understanding the basics is a fundamental skill if you want to dive into the cryptocurrency trading world. There is an amount of certainty but nothing is guaranteed. Another article is going to be released tomorrow, so stay tuned!
Let me know what you think in the comments down below!