Simple chart analysis approach, which wins a lot of times
I have been trading since 2005, in stock exchanges, FOREX and recently Cryptocurrency markets. Each of the above markets have their own characteristics. For example, Stocks are very feasible to be fundamentally understood, Forex has big volume, non-stop trading and Crypto is very fluctuating.
And do they share common characteristics with each other? Yes, chart patterns and technical analysis. Or maybe we can say, people/investors/traders’ behavior.
I know these candles and shadows are turn off signs for many of you, but hold on a minute. If you have ever blamed yourself for being missed out from trading and make a passive income or increasing asset for yourself, read this post to the end!
Value Traders
There are different types of traders: Day traders, swingers, long term/midterm etc… and you may be non of them but a value trader, or better to say, value investor. it means you buy things (BTC, Apple Stock, Gold etc) when the price is considered lower than expected and you hold it for a while.
The glory in value investment or trade, is you don’t care what happens to the price next minute or day after you bought the thing! It was a value investment, and you only need to wait till it pays off.
So, how we can spot a VALUE trade?
Moving Averages
“A moving average is a calculation to analyze data points by creating a series of averages of different subsets of the full data set.” This is how wikipedia describes MA, but leave it there and just let me tell you what they can do for us.
MAs can show us if price of a commodity for a specific time-frame can considered valuable or not. I don’t want you to get in to the stats and calculations (though if you are interested, that would be perfect to know the math behind) but what I want you to know, is how to use them.
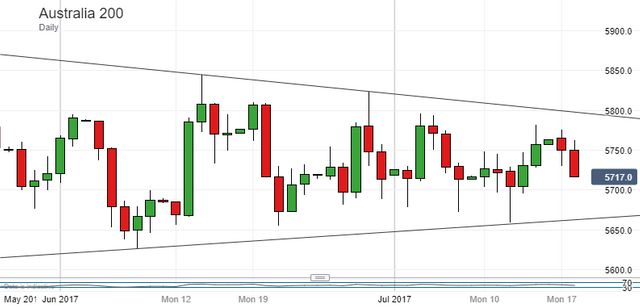
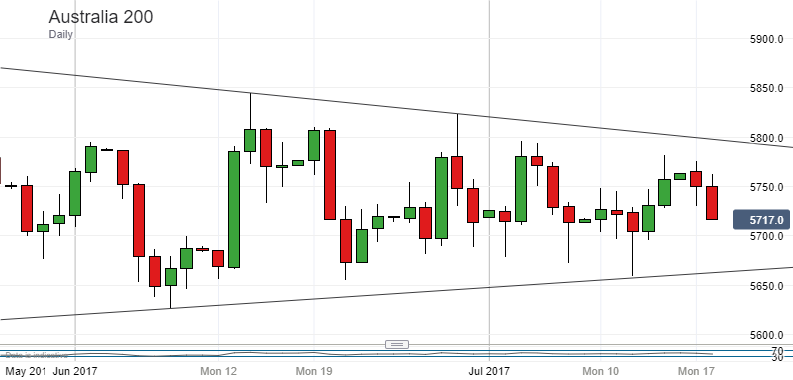
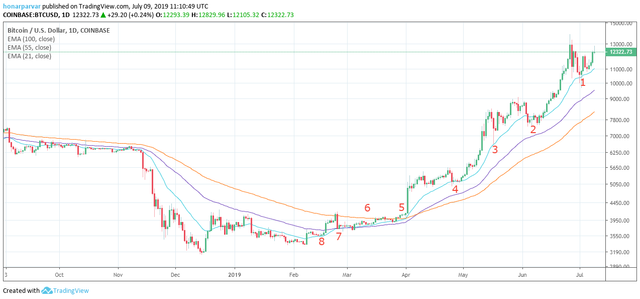
In your trading platform, draw EMA21, EMA55 and SMA100 (even the last can be EMA100). Now let me bring a sample chart here to show how it goes on. BTCUSD chart for example:
Whenever the 3 MAs are close to each other or crossing each other, it’s a stay away sign. probably sideways will happen or sharp and volatile moves right after. but when the order is signal, EMA21, EMA55 and EMA100, it means we are in a downtrend.
If it was other way: EMA100, EMA55, EMA21 and then signal, it means we are in an uptrend.
Now when you realized the trend direction, you will wait for the signal to touch the EMA21. In an uptrend when the price touches the EMA21, it will be considered as a buy signal and in a downtrend it is a short signal. I can’t make it any simpler!
Stop loss and Exit strategy
In the uptrends, you put the buy order exactly at the EMA21 in your time frame. Stop loss at the EMA55 (or if you know Fibonacci retracements, better to apply on that) and take your profit at the level 3 times above the SL margin. If you are in a down trend, should exactly do opposite.
Now let’s slide back to the past. In the given BTC Chart, you can see in 1–5 points, the MAs are in the uptrend order and each time the signal hits the EMA21, bounces back nicely and never touches the Stop Loss (EMA55). So you can imagine in this rally you could have 5 successful entry and exits with no call on margin.
This is not a financial advise. The purpose of this post is just giving you awareness and knowledge, not financial advice.
This post was originally published on my Medium account.
To listen to the audio version of this article click on the play image.

Brought to you by @tts. If you find it useful please consider upvoting this reply.