The chart trading is very extraordinary!!!
Heiken-Ashi - Money Machine
Hello, my best friend! You have noticed that we have new things for you. This will help you create your own "money machine," of course, we talk about the Heiken Ashi indicator.
Let's see how to do this. First, open the settings window, and go to the "indicators" tab, where we find the Heiken Ashi indicator and click on it, as shown in Figure 1
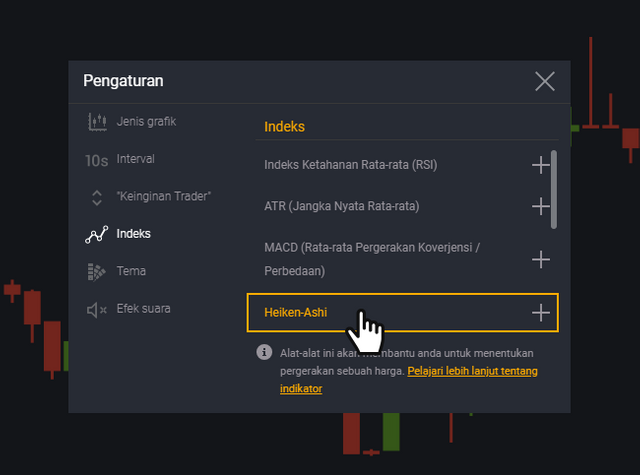
Figure 1. Selecting the Heiken Ashi indicator in the platform settings window on the "indicator" tab.
After we turned it on, it would be better to find out what to do next. The indicator itself is very similar to ordinary candlestick charts. However, if you take a closer look you can find a difference. The indicator itself is the transformation of the current price value, which aims to make a clear visualization of the current price trends in the market. The Heiken Ashi chart is shown in Figure 2.
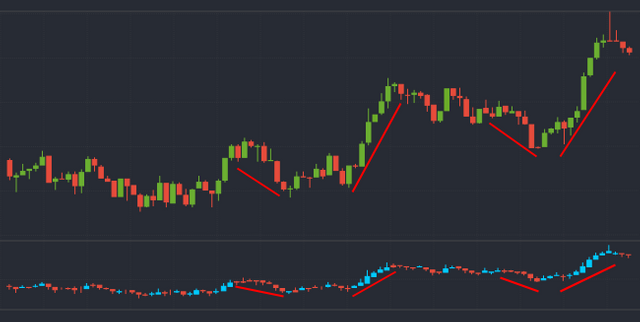
Figure 2. Trend of price and trend charts on the Heiken Ashi chart.
As we saw in Figure 2, the original price chart is more dynamic, price movements form a very ambiguous signal. The replaced candlestick pattern is more sudden, which makes the beginning of the trend less prominent. Unlike the original price chart, Heiken Ashi charts are less vulnerable to change. Clearer trends and less active dynamics allow the use of candlestick analysis to determine future price movements.
Consider a simple strategy, but it is very effective to work with the Heiken Ashi indicator. This is a "Doji", a candlestick structure.
Doji Strategy
The meaning of Doji is that this indicator shows the ambiguity of a trader's view and thoughts about the future prospects of prices. This strategy is based on a candlestick structure and allows you to determine trend reversals to take a more favorable position at the start of a trend.
It means:
If the trend has increased for a long time, and sudden candlesticks such as the "Doji" umbrella appear, then we can say that the market is no longer confident about further price increases and is worth playing short (lower bets).
If the trend goes down and suddenly there is a candle that looks like an umbrella, then the market is no longer sure about future trends, and it is worth raising the rating (betting higher).
In Figure 3 we can see that the candlestick structure appears on the indicator more clearly and gives a fairly accurate idea of the nearest prospect for price.
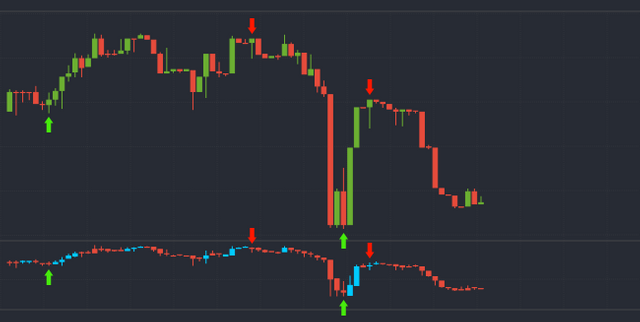
Figure 3. Doji candlestick structure on EUR / USD instruments.
Because it can be seen in Figure 3, price candles do not provide a clear signal, when the Heiken Ashi indicator has indicated an ambiguity in price movements. There is a tendency to break up, which means you can enter the trend at the beginning without losing time.
You can also see that this indicator allows you to define the candle structure better and clearer, but it is likely that this indicator does not end there, and in the next article we will look at how to build strategies with other technical analysis indicators.
In conclusion, I want to say that this indicator represents a completely different view on trading, which can be complemented by various indicators, so we will look at the strategy with the indicators in the next article.
We recently wrote about the Canadian dollar and made predictions about its prospects directly. We say that dollar expansion does not stop. Canadians, using their strong position and growing value, quickly move the chart down.
We have relied on data on large trader positions in the foreign exchange market and found that so far traders have not revised the outlook for the Canadian dollar in relation to distant Australian counterparts.
During the last 3 weeks, the schedule continues to fall. Traders pushed the position of the Canadian dollar up.
As can be seen in Figure 1, prices for the last month continue to move down without changing the emerging trend.

Figure 1. AUD / CAD price charts for the period starting 01/01/2018 to 08/10/2018.
As can be seen in Figure 1, the trend has been going on for quite a long time. That makes us think of an immediate reversal for correction. According to the schedule, we see that the price slope is significant. This fact means that traders' positions continue to grow in volume and reach new maximums. For this purpose, we consider the current value of the main trader index and find out how strongly traders continue to believe in the Canadian dollar.
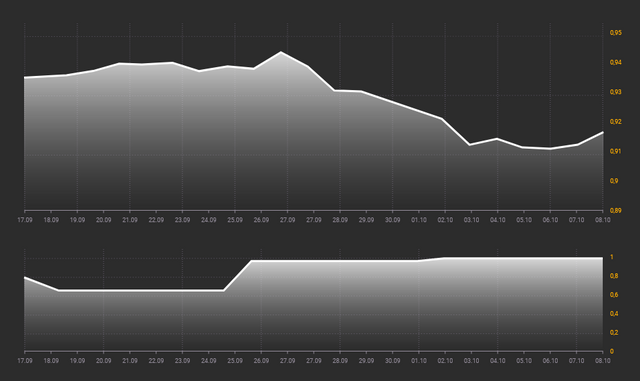
Figure 2. Chart of AUD / CAD prices and main trader charts for the period from 17/09/2018 to 08/10/2018.
As can be seen in Figure 2, the index value reaches a maximum of 1, which means that the main trader position is now at the local maximum. This shows strong confidence in the Canadian currency. However, it can also be a prerequisite for a quick correction if the trader runs out of fuel. However, the recent trend shows that positions continue to grow and get new highs, indicating that the trend will continue.
Estimates in the near future to open the position "down."