Technical Analysis Ethereum Classic
Hey guys so i am not a professional trader by any means but i decided to share my thoughts based on what i have learnt over the past few months.
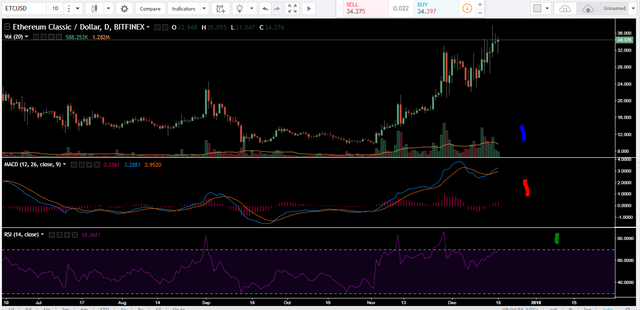
So the image above has 3 water marks
so for starter's we see that the volume( Blue watermark ) for ethereum classic is positive right now , there appears to be a positive market sentiment and people seem to be buying in Ethereum Classic today.The volume in the last 24 hours was $482,377,000 USD which is one of the key indicators i consider when making a trade.
Secondly we consider MACD scale( Red watermark ) on the daily chart.
The blue line(12 day exponential moving average) is above the orange line (26 day exponential moving average).This is generally indicative of an upward trend especially when followed by volume.
Lastly we consider the Relative Strength Index (Green watermark).
This shows that there is potential to break out from current price range and reach a potentially overbought level.
I bought some ethereum classic at 31 USD and i am looking to sell once i see the Relative strength index becomes a little more extended so in essence this is a short term trade.My exit strategy is to get out at around 39 USD.
Note : I am still learning and i am not giving any advice on how to trade just stating my strategy.
Feel free to let me know what you think of my analysis.
Looks Like you nailed it !! Great insight !
Cheers bud gonna be a crazy few days in crypto this coming week lets see how it works out