Trading Ideas on Wednesday: BTCUSD, XRPUSD, LTCUSD and ETHUSD
Good afternoon my dear steemians and traders!
💰 Capitalization of crypto-economics: $ 430.309В
💵General trading volume: $ 17.345B
💥The share of bitcoin: 41.8%

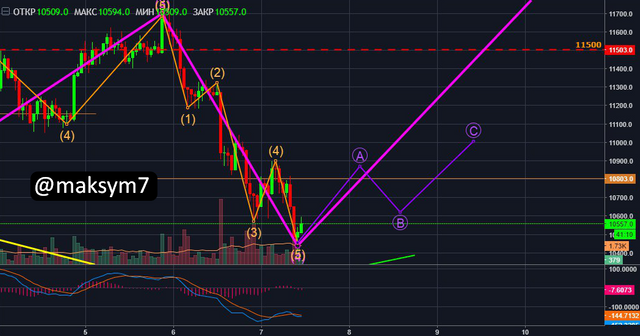
BTCUSD: fell below expectations
All supposed waves were formed, but it was not possible to gain a foothold above the supporting Pivot. It should be noted that the fall was lower than expected and within 4 large waves, not only A, B, C, but also 5 waves of a downward trend were formed. Now the market is in the bifurcation point, there is some uncertainty of the future price behavior. However, oversold on MACD is high, so the price is likely to draw A, B, C up, but it's hard to say whether the 5 (big up) wave will form or not, because by analogy with 2015 it should take a few months to flat.
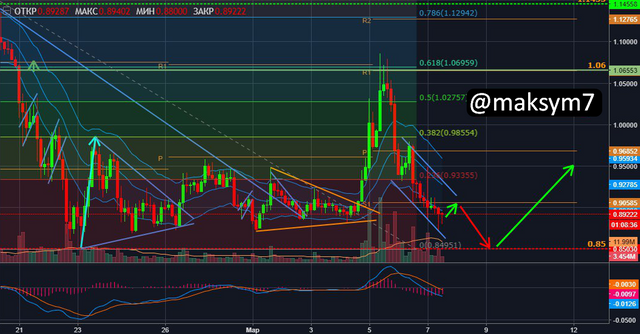
XRPUSD: graph h4
After the expected decline to S1, Ripple fell even lower. A downward channel has formed, which should align with the Keltner channel after a couple of hours, apparently after a slight increase to S1, the drop will continue and in 2-3 the price will drop to support of 0.85 $. In favor of this scenario says the lack of overselling on MACD (h4), although after such a fall it should be huge. It should be noted that the growth to 61.8% Fibo, after the breakdown of the triangles, was caused by a positive news background, but above the level of 1.06 $ bulls failed to gain a foothold. You can risk opening short-term shorts from S1 to $ 0.85, and already from the support level to open long positions.
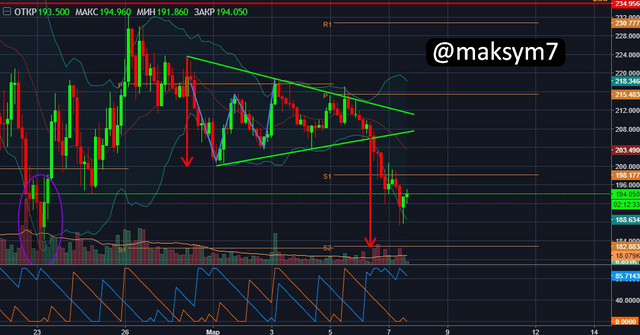
ETHUSD: graph h2
ETHUSD dipped too deep, the double bottom could not be drawn, during the fall, the price broke through the support of $ 820 and the prospects for a return higher in the next 2 weeks are very vague, at best there will be a test of this level, as shown in the figure. Due to the high correlation with Bitcoin, one can observe the same Elliot model as Bitcoin. And in case of a further fall of the crypto currency # 1 - ETHUSD will decrease to support $ 725 and 23.6% Fibo, given the weak oversold on the oscillator, this is quite possible.
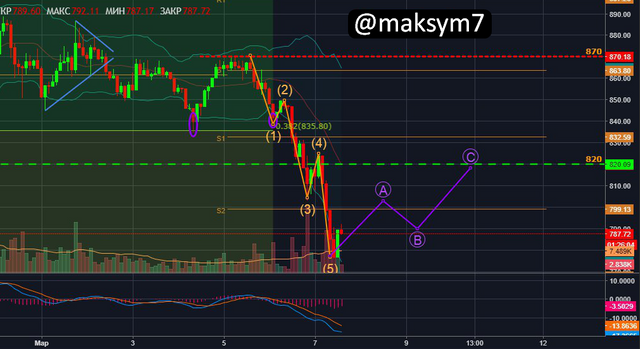
LTCUSD: Decrease to Weekly S2
LTCUSD after the bearish signal on the breakdown of the triangle, has not yet managed to decrease to S2, where the working pattern lies. On the h3 timeframe you can observe a bull hammer, but it will raise the price to S1 at the maximum, after which for 10-12 hours the price will most likely decrease to S2. The $ 210 level lost its value, as the price ignored it. Aroon while weakly signals down, apparently the signal will increase after returning to the middle Bollinger band.
If there are here those people who share my opinion with me, then please follow me! If there are critics, then please leave them in the comments. I'll be very happy!!!
I wish you profits!!!

Information presented in this material is the opinion of the author (@maksym7) and is not an offer to a specific action.
Keep this up, Followed you for more :)
This post has received a 6.58 % upvote from @booster thanks to: @maksym7.