So you want to open a position, but don't want to track the charts yourself? (MarketScannerBot tutorial)
Image you want to get into an eth position right now. You believe it has potential to go 10x in the next two years, but want to minimize the risk of buying into a failing rally.
You want to buy the dip. Wow, the dip. BTFD. As if we're in a bull market again. At least there's opportunity, right?
Now say the dip is defined for you as this:
The 1d, 12h, 6h, 4h, 1h chart all have an RSI(14) below 25
Simple enough to check, but you have a full-time job. You don't have the time to check the charts. What if someone could do it for you?
This is where MarketScannerBot comes in. It tracks the chart for you and it sends a you a message when your condition is true. Let's build a strategy with the trigger defined above:
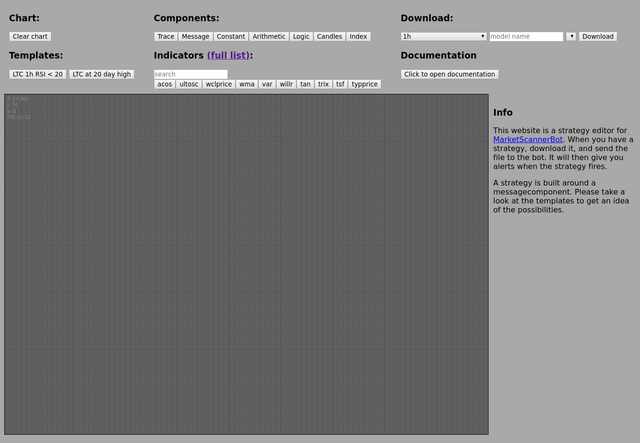
The robot comes with its own development environment. It can't be hosted on telegram, but you can find it here. This is where you design your strategy. It starts off with a blank design space, but you can click through the templates to see how a strategy could be defined. For now, we will stay with the blank canvas.
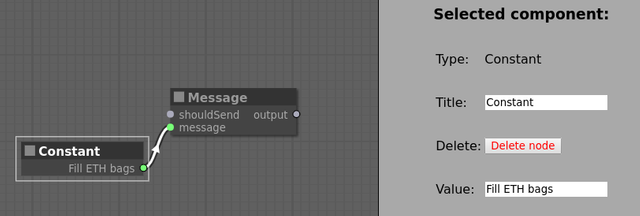
Now the bot will need to send a message to you when your strategy fires. The first steps are to create a message component, and a constant component holding your message. This signal will notify you with the reminder "Fill ETH bags".
Now how to decide when the message should be sent; the definition states we need 5 RSI calculations, over 5 different timeframes. Let's start with one calculation: RSI(14) over 1h candles less than 25.
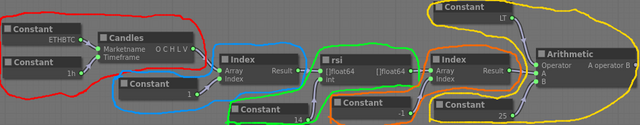
There are five steps to doing this:
Fetch candles (red)
The candle component fetches candles for ETHBTC for the 1h timeframe.Extract close prices (blue)
The index component takes the second element (counting starts at zero) from the candles output. This is the set of closeprices, ordered from old to new.Note: the bot stores 200 candles, if and only if Binance has at least 200 candles for the time frame.
Calculate RSI (green)
Add an rsi indicator component, and plug in the constants. For the RSI, only the period is needed.Extract latest RSI value (orange)
Since the newest candle is at the end of the input, the newest RSI will also be at the end. Take this value by taking the element with index negative one.Check if latest RSI is below 25 (yellow)
An arithmetic component can compare two numeric values, we use the operator LT to indicate we want less than 25.
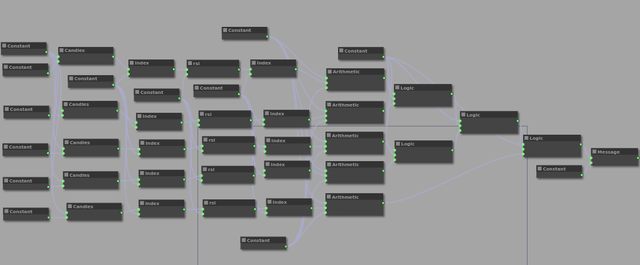
The output of the component is true when the RSI is less than 25 on the one hour chart. It could be connected to the message component, and a message would be sent every time this happens. However, we want to use this over multiple timeframes. Let's copy the above four times:
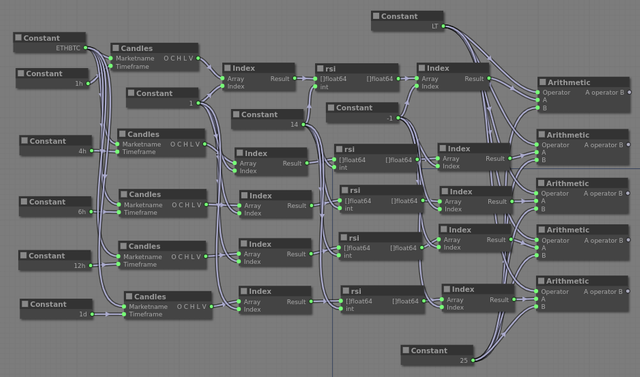
We now have five arithmetic components, each one saying something about their own candle set namely: the rsi on my candle set is lower than 25. The output can be 'true', or 'false'. However, we don't want five outputs, just one. It must state that
arithmetic component 1 is true AND
arithmetic component 2 is true AND
arithmetic component 3 is true AND
arithmetic component 4 is true AND
arithmetic component 5 is true
Enter the logic component:
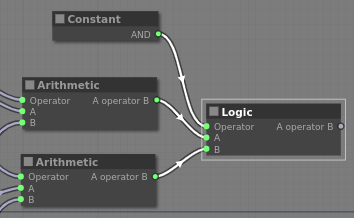
using this set up we can check if both inputs are true using AND, one of two is true using OR, both are the same using EQUAL, both are different using NOT_EQUAL. We will use AND, but using only one component doesn't get us all the way. We will need to chain some logic components to reduce all five values into one.
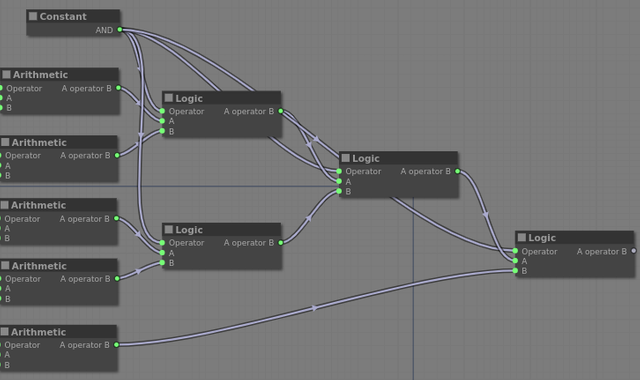
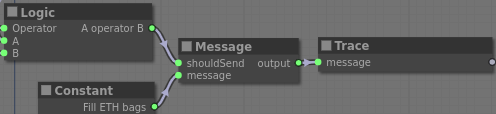
The output of the most right logic component will represent whether our definition is satisfied, will return true when we want a message to be sent, and false otherwise. Connect the logic component to the 'shouldSend' input on the messagecomponent from step 1, and we're done!
To check whether the model is built correctly, create a trace component, and connect it's input to the message component's output. The trace component should read "message". If it reads "error ...", it hopefully directs you to the place where there is a problem, and you can fix it yourself.
The next step is to export the strategy to the telegram bot. In the top right of the screen you can enter a name for the strategy, select how often the robot should check your strategy, and then click the download button. Your browser will now ask where you want to save the file. Once it is downloaded, send the file to the telegram bot, and activate it.
Congratulations! You have invested 30 minutes now, but will never have to check the ETH chart again!
Disclaimer: yes, this is a paid service. However, you can use five strategies for free, forever. You will be limited to hourly scanning frequencies or higher unless you buy extra slots.
You got a 7.12% upvote from @dailyupvotes courtesy of @minnowpond!
You got a 2.14% upvote from @minnowvotes courtesy of @minnowpond!