Is the US Dollar turning back down?

Today, the recent bounce in the USD ended dramatically. It appears that its recent downtrend may be about to continue. I like trades of GBP, CAD and JPY against the dollar. Check out my analysis below.
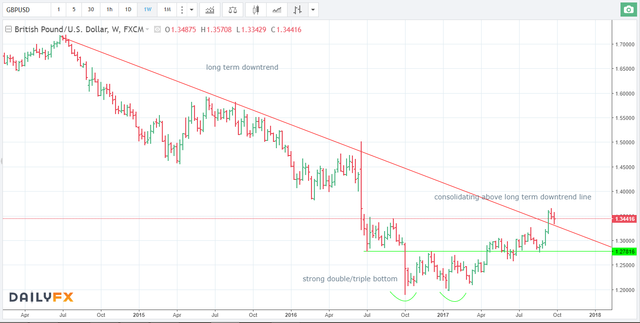
GBPUSD
This pair has been in a long term downtrend. But recently, we have seen a strong turnaround in the GBP. GBP USD formed a strong double/triple bottom and recently broke above the neckline AND the long term downtrend line. See the weekly chart below:
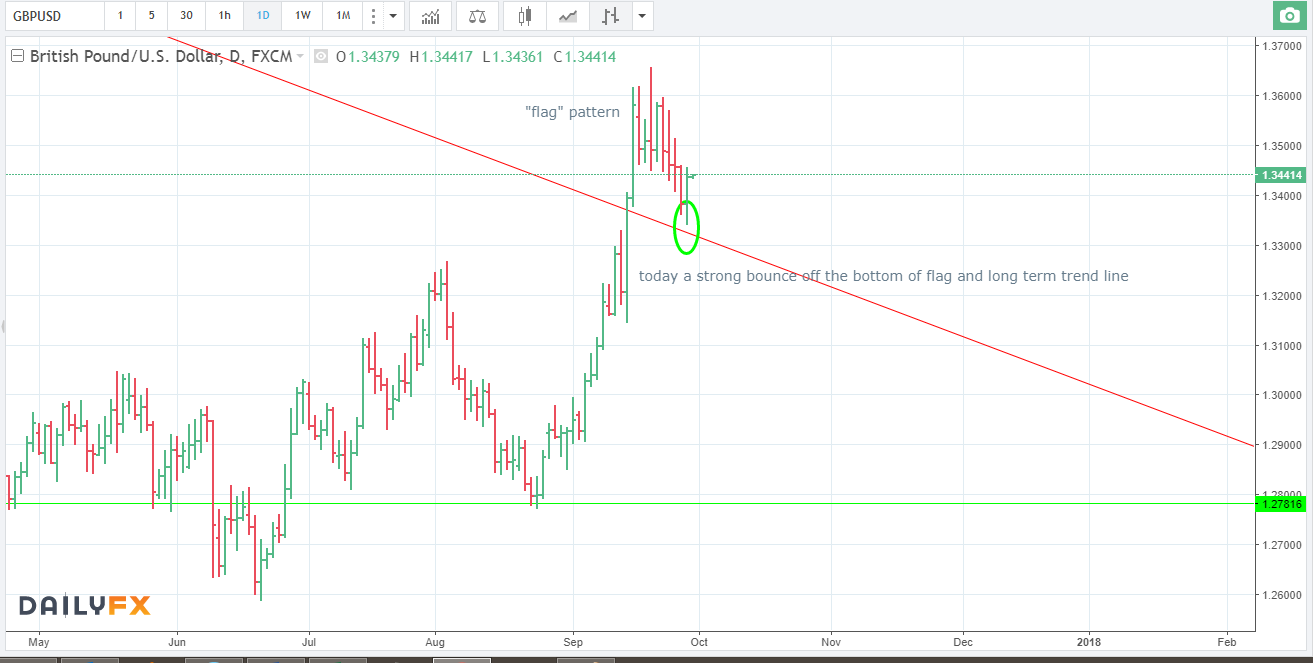
Today price fell and closed on the high, after a possible flag pattern. They appear poised to continue a strong uptrend.
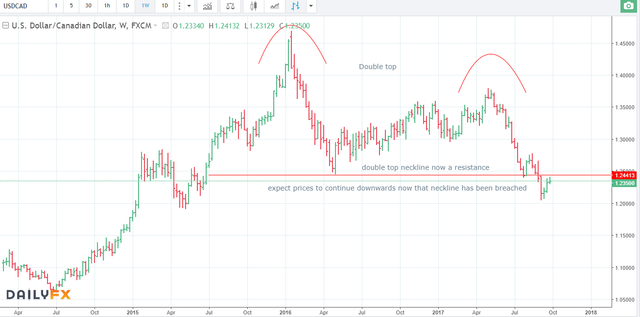
USDCAD
A few weeks ago, USDCAD fell below the neckline of a long term (unconventional) double top. This indicates that the direction of this pair for the next few months is likely to be lower.
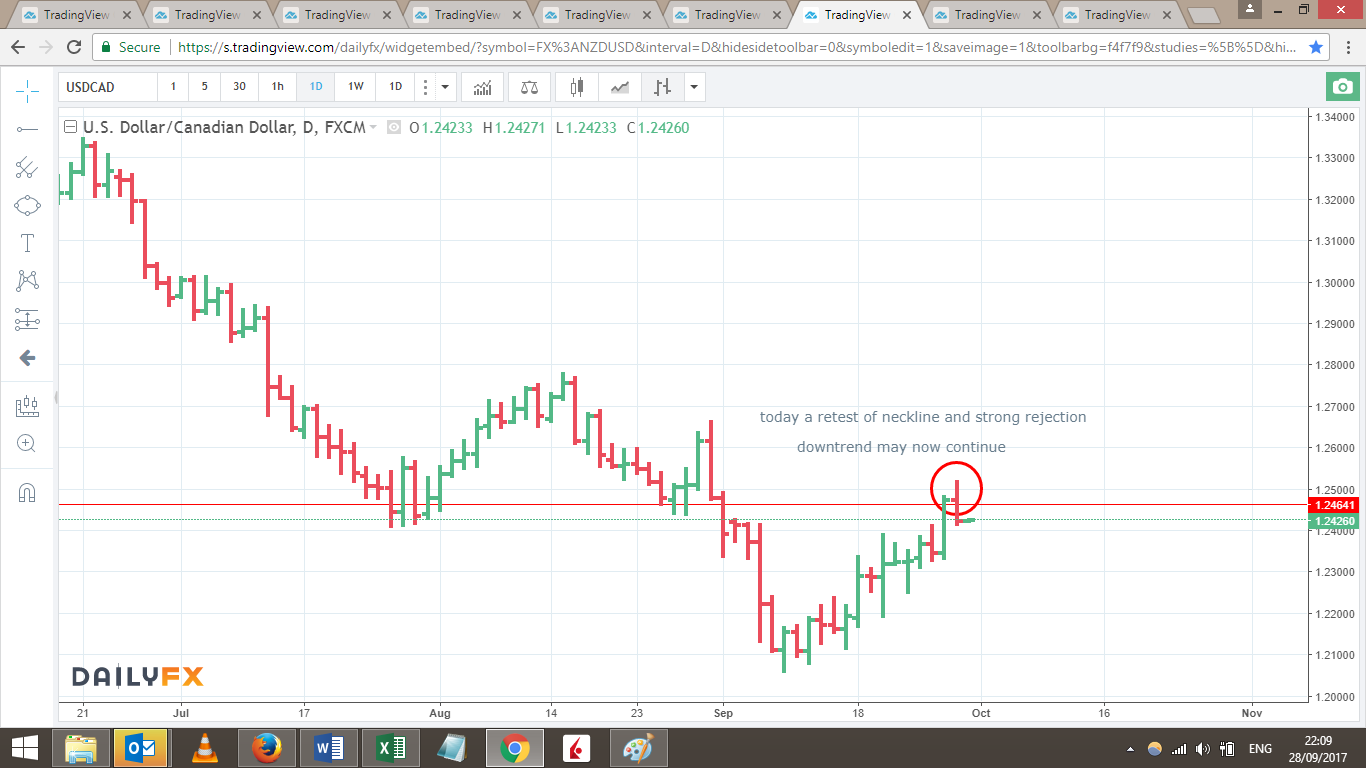
Often, after a breakout from patterns like this, prices retrace to the neckline before turning back and continuing the trend. That is exactly what happened today, and therefore forms a good place to test the downside of this pair.
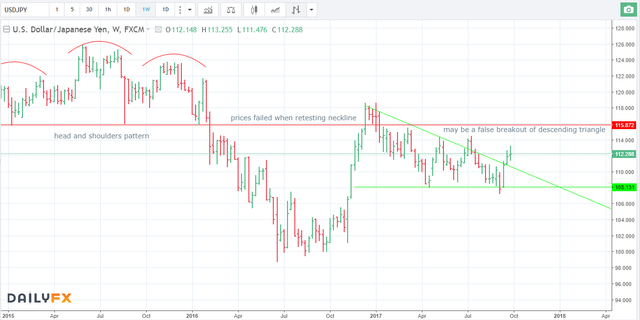
USDJPY
USDJPY fell out of a H&S pattern in 2015 which set off a massive down trend. After bottoming last year, it rose after the presidential election all the way back to the neckline of that H&S pattern. However, it failed and has been trading in a range below that line since. One could argue there is a descending triangle pattern forming.
Below is the weekly chart:
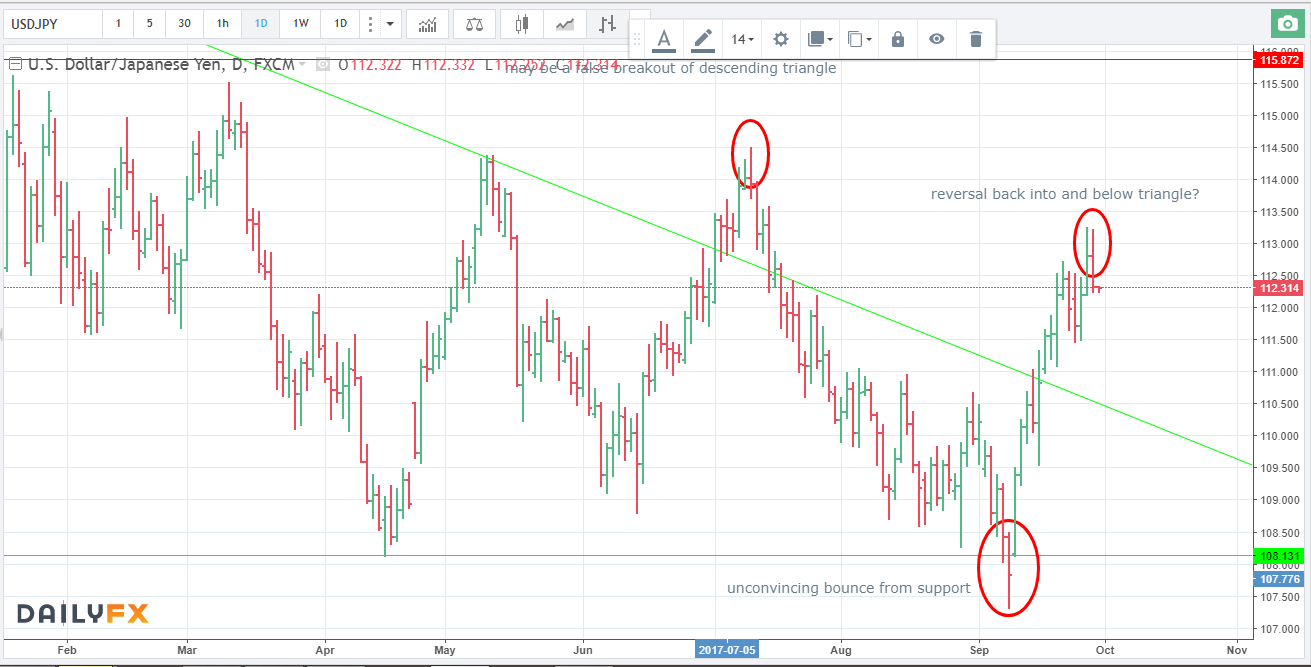
If we look more closely, at the daily charts, we can see that prices turned back today strongly, closing on the low of the day. If prices continue to fall tomorrow, we may see a retest of the support (the recent bounce was not convincing and there is a gap to fill), and potentially much lower. Here presents us a good risk:reward opportunity to test the down side.
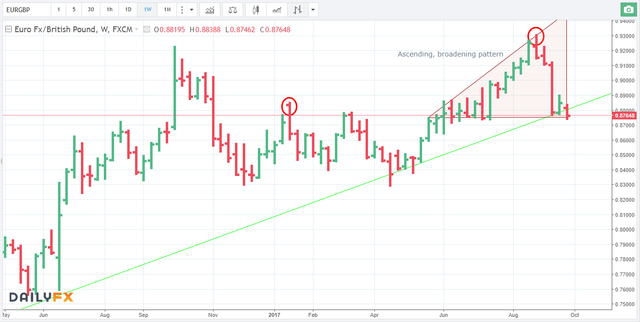
EURGBP
As a bonus, I also like the downside of this pair. I took a big profit from the recent fall and have been waiting for an opportunity to get back in. Today may be that day.
Prices recently turned back at the same place as last year’s high. You can see that prices have been consolidating at this area for the past two weeks now and may be dropping below the long term support line. The weekly chart is below:
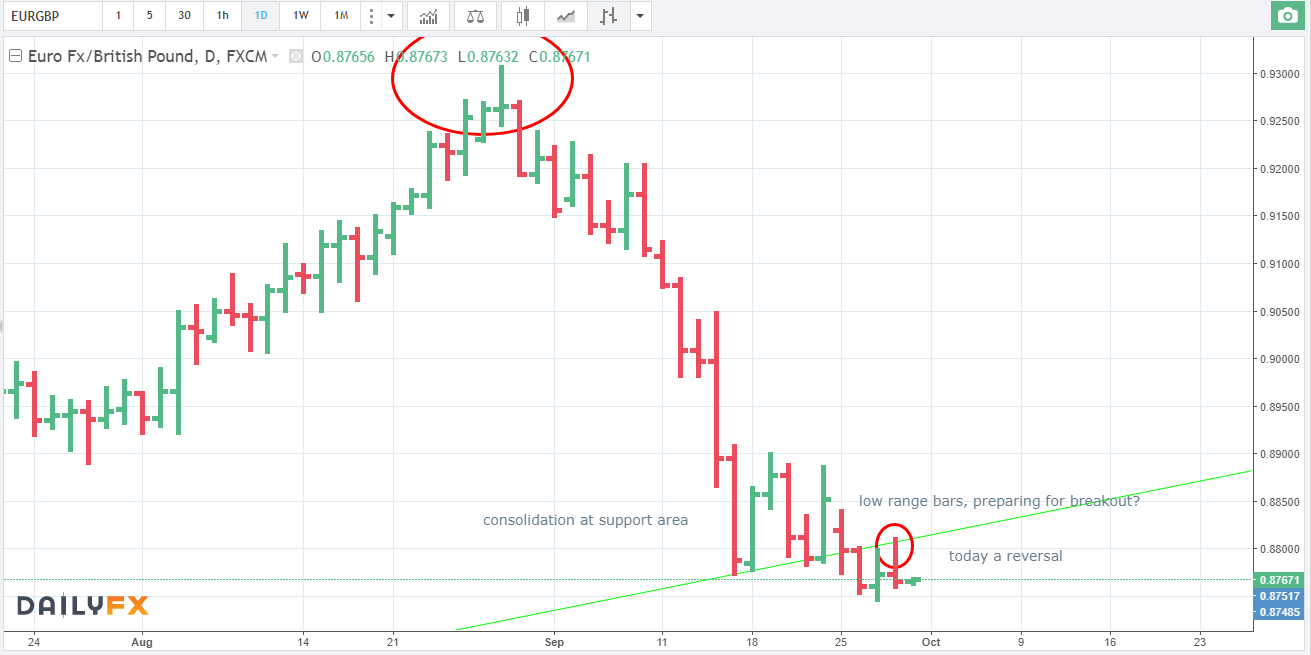
Prices have been slipping lower over the past few days and today rose to a high before reversing and closing on the low of the day, arguably below the long term trend line. We want to test for further downside from here. You can see this below in the daily chart:
What do you think?
Thanks for reading, any feedback is much appreciated!
Follow me for updates and more trade ideas!