weekly ethereum price analysis based on traders behaviour
Ethereum is a native coin of the ethereum network that can be transfered from one smart contract address to another. It was able to transform from a proof of work consensus to a proof of stake consensus. Therefore ,it is being run by validators when stakers lease their coin where they receive reward based on their staking amount. On Monday the 20th of July 2020, ethereum started trading at around $234. By Tuesday the same week, the price rises to around $246 but later came to drop to around $241 on Wednesday the same week. On Thursday, the price further rises to around $269.The price slightly dropped to around to around $259 the same day. On Friday the same week,the price further rises to around $279. This upward and downwards movement of ethereum market is due to traders behaviour which can further be explained as follows ;
Traders behaviour
Ethereum has a huge community of traders due to several dapps built on its network. This makes it to be well tradeable in an upward and downwards direction by traders and still make them to become profitable. When the market for ethereum is moving upwards,that will signal the trader of an oversold condition thus they should purchase a certain amount of ethereum with their USDT balance while when the market for ethereum is moving downards,that will signal the trader of an overbought condition thus they should sell a given amount of previously bought ethereum so that their account do not lose the profit generated. Since the market was bullish the whole week, here is the whole analysis for that week;
1.Ethereum bearish price analysis based on traders behaviour.
In a bearish market, ethereum will be trending in a downwards direction. On Monday the 20th of July, ethereum started trading at around $234. By Tuesday the same week,the price dropped to $246 but later came to drop to around $241 on Wednesday the same week. On Thursday the same week,the price rises again to around $269. The price then falls to around $259 on same day but came to rise to around $279 on Friday the same week.This market movement is being indicated as from the candlestick chart below;
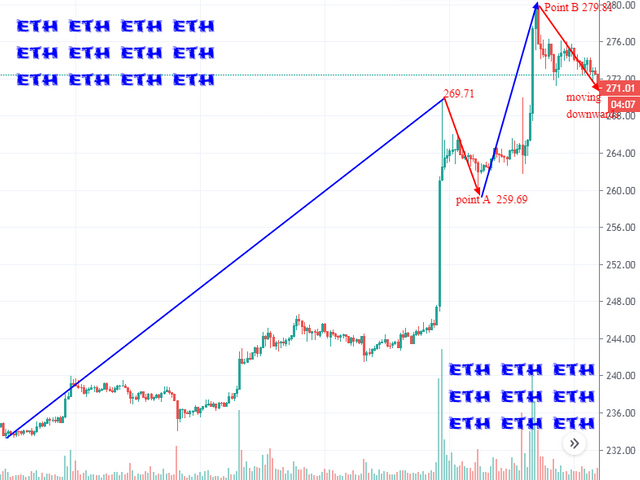
The above is the ethereum market against USDT. There are two points indicated. There is A and B. Before A, the market moved to $269.71 from its previous low of around $234. This upward movement is as a result of the sellers being more than buyers thus causing the market to gain an upward pressure and moves to $269.71 as stated above. At $269.71, there are more buyers buying their ethereum in the hope that the market will continue moving upwards. This again causes the buyers to exceed the sellers volume thus causing the market to gain a downward pressure where it slightly moves downwards to point A at around $259.69. At point A, more sellers are again starting to sell some previously bought ethereum in the hope that the market will continue moving downwards. This causes the market to resist to continue moving downwards due to the number of sellers exceeding the buyers. Instead, the market reverse and moves upward to point B at around $279.81. If the sellers will continue exceeding the buyers volume, then the market will continue moving upwards to around $300 by end of the week. If you had previously bought your ethereum, you can sell at current market price since the market is starting to move donwards as you can see or can continue holding to make more profit when it reaches around $300 though it will take time to reach that price,
Summary
Ethereum which is a native coin of ethereum network transformed from proofs of work to proof of stake consensus. It can therefore be transferred from one smart contract address to another without involvement of a third party thus making it a decentralised asset. Stakers can lease their coin to validators to use them to secure the network as well as to validate transactions taking place on the network thus in return they receive reward for doing so. When buyers for ethereum are more than sellers volume ,then the market will be moving in a downwards direction while when the sellers are more than buyers volume then the market will be moving in an upward direction.Can sell at curent market price of around $280 or can continue holding until it reaches $300