Top stocks to watch for the 2nd week of November: $APO $LUV $SIVB $AMD $ONB $SJI
Wazaaaaaaaa stemian traders! Hope you guys had an amazing weekend. Today I'm going to talk about the stocks I'm going to watch during the second week of November. These are stocks I see the most value in. Also, take into account the fact that I'm still using a demo account and I'm not giving financial advice to anyone, as you can read in my disclosure. This post and many others represent solely my opinion. Also don't forget the fact that I'm not giving stock picks. These are stocks that might rise (or not) this week. This is really short-term trading.
I'm also watching closely $RNG, $KEYS and $GNRC, but I'm not going to break them down. $KEYS has its earning in the 20th of November. $RNG and $GNRC aren't a great, as the ones below, due to the proximity to a resistance and the volatility.
So, before jumping into the stocks do not forget that there's a high likelihood of a red week in the stock market. This means that I'm going to watch closely how the overall market is performing, through the S&P500, before buying any stocks and I won't buy any shares when the market opens.
Just another final note before reading my analysis. Some images might be too small, and you might not be able to see the details I talk about. So, my recommendation is to click the right side of the mouse and select open on a new window. Then you can zoom in and see better. Or you can open your own charts. I'll always refer the timeframe I'm analysing.
1. $APO: Apollo Global Management, LLC
 The image above is the 4 hour chart. The price is currently above the major support area at $28.00 and below the major resistance area at $36.29. There's also a strong resistance at $33.36. During the last 2 days of the week $APO dropped 4.26%, so I'm going to be careful trading this stock.
Since the end of October, the stock is confirmed to be in an uptrend because, if you look at the 14RSI, you notice that it bounced twice in the bull market support line which is the green line. The 14RSI tested 6 times these two lines during the uptrend market in May and June. In addiction the 14RSI had the same behaviour in November and December of 2017 and January of 2018.
The image above is the 4 hour chart. The price is currently above the major support area at $28.00 and below the major resistance area at $36.29. There's also a strong resistance at $33.36. During the last 2 days of the week $APO dropped 4.26%, so I'm going to be careful trading this stock.
Since the end of October, the stock is confirmed to be in an uptrend because, if you look at the 14RSI, you notice that it bounced twice in the bull market support line which is the green line. The 14RSI tested 6 times these two lines during the uptrend market in May and June. In addiction the 14RSI had the same behaviour in November and December of 2017 and January of 2018.
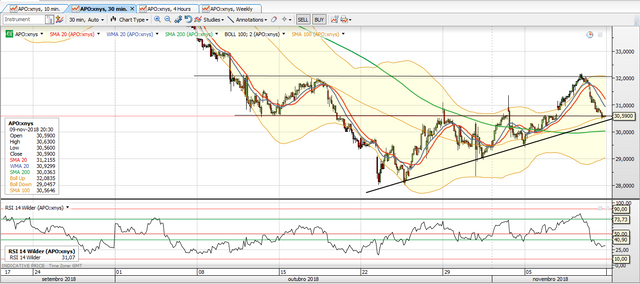 In the 30min chart shown above almost everything looks perfect: The price bounced 3 times at the 100SMA, the price is currently testing the support line at $30.59, you can easily draw an uptrend pattern. My only concern is the fact that 14RSI break through bull market support line on this timeframe, which is the green line. To me this means weakness. Finally, I can tell you that I'm going to be an happy buyer if the price breaks and tests the $32.00 resistance without extreme volatility.
Stock Alerts: $30.00 and $32.00
Final Note: This stock is riskier because its 'moves' are bigger than the normal when we consider the percentual value.
In the 30min chart shown above almost everything looks perfect: The price bounced 3 times at the 100SMA, the price is currently testing the support line at $30.59, you can easily draw an uptrend pattern. My only concern is the fact that 14RSI break through bull market support line on this timeframe, which is the green line. To me this means weakness. Finally, I can tell you that I'm going to be an happy buyer if the price breaks and tests the $32.00 resistance without extreme volatility.
Stock Alerts: $30.00 and $32.00
Final Note: This stock is riskier because its 'moves' are bigger than the normal when we consider the percentual value.
2. $LUV: Southwest Airlines Co.
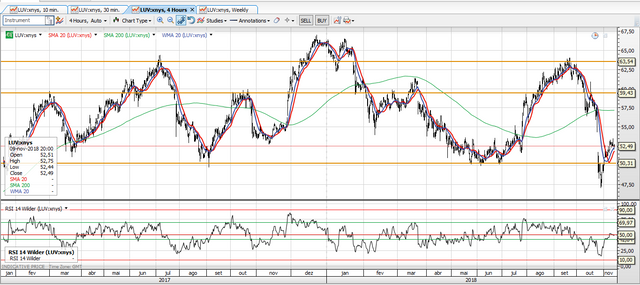
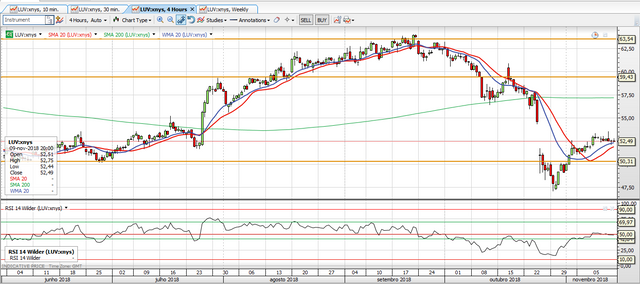 The first image is the overall picture of the stock and the second one is the one you should be looking at because it has more details. $LUV is a stock that has been too quiet this week and I prefer stocks that have had a pullback. Although, I like the 14RSI above the green line and the October gap. Usually a gap offers a strong support. There isn't too much to say about this other than the fact that the long-term support on the chart stands at $50.31 and the long-term resistance at $63.50. Also, you can easily identify a strong resistance between this range at $59.60.
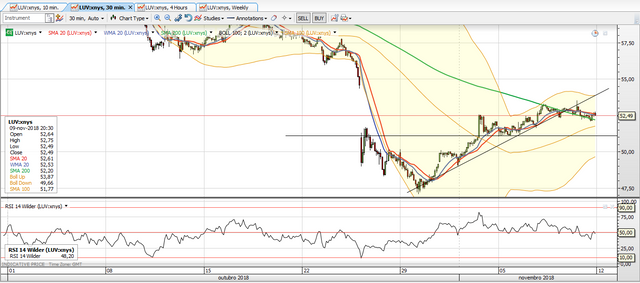 This is the 30min chart and is much more interesting than the 4H. Unlike the other charts, in this one I didn't draw the two green lines on 14RSI because the stock is too volatile on this timeframe (if you consider last month data). Thus it's hard to identify the bull market range on the RSI. Although, you can easily spot the slowdown of the trend as I suspected before. First, the price breaks the trend line that was created since the beginning of this month. Second, the 14RSI is showing signs of a downtrend.
Stock alerts: $51.10, $53.50 and $55.00
Final Note: This stock is riskier because its 'moves' are bigger than the normal when we consider the percentual value.
This is the 30min chart and is much more interesting than the 4H. Unlike the other charts, in this one I didn't draw the two green lines on 14RSI because the stock is too volatile on this timeframe (if you consider last month data). Thus it's hard to identify the bull market range on the RSI. Although, you can easily spot the slowdown of the trend as I suspected before. First, the price breaks the trend line that was created since the beginning of this month. Second, the 14RSI is showing signs of a downtrend.
Stock alerts: $51.10, $53.50 and $55.00
Final Note: This stock is riskier because its 'moves' are bigger than the normal when we consider the percentual value.
3. $SIVB: SVB Financial Group
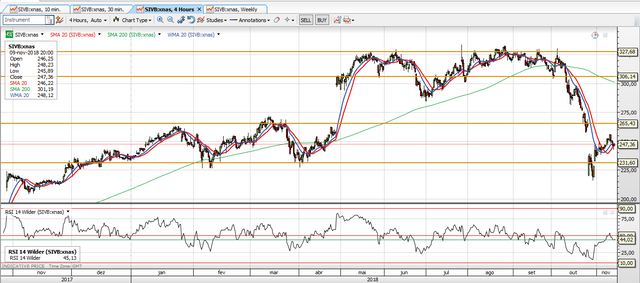
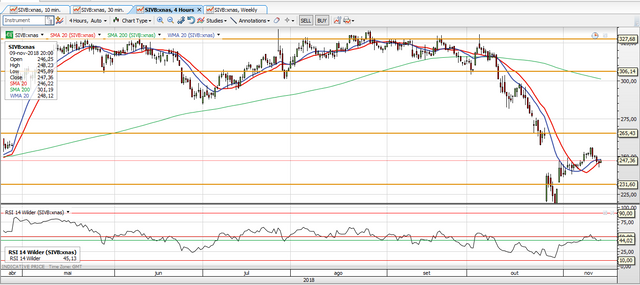 Again, these are the 4H charts. The price is currently trading at $247.36, above the main long-term support line at $231.60 as you can see from the first image. At $265.43 there's a strong resistance that was reached twice in January and March. Also, the top of the range has two strong resistance levels at $306.14 and $327.68.
Looking at the first image, the green line in the 14RSI is the support line for a bull market and was respected in November through January this year and during that small uptredn in July and August.
Something I really enjoy on this chart is that healthy pullback of 3.27% and that small little green candle, that is hard to notice on the second image. But I'll get there in the 30min chart.
Again, these are the 4H charts. The price is currently trading at $247.36, above the main long-term support line at $231.60 as you can see from the first image. At $265.43 there's a strong resistance that was reached twice in January and March. Also, the top of the range has two strong resistance levels at $306.14 and $327.68.
Looking at the first image, the green line in the 14RSI is the support line for a bull market and was respected in November through January this year and during that small uptredn in July and August.
Something I really enjoy on this chart is that healthy pullback of 3.27% and that small little green candle, that is hard to notice on the second image. But I'll get there in the 30min chart.
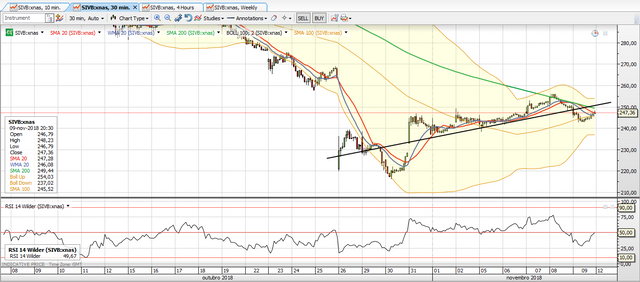 On the 30min chart, there's a break of pattern. The price break through the upward trend line. The 14RSI also, break through that short-term support line at 50. But it is creating a strong momentum and we're going back up to the 50 level o the 14RSI.
Stock Alerts: $257.00 and $214.00
On the 30min chart, there's a break of pattern. The price break through the upward trend line. The 14RSI also, break through that short-term support line at 50. But it is creating a strong momentum and we're going back up to the 50 level o the 14RSI.
Stock Alerts: $257.00 and $214.00
4. $AMD: Advanced Micro Devices, Inc.
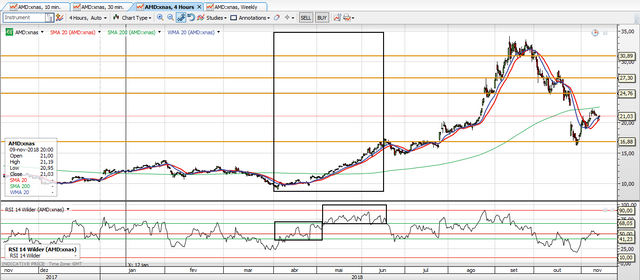
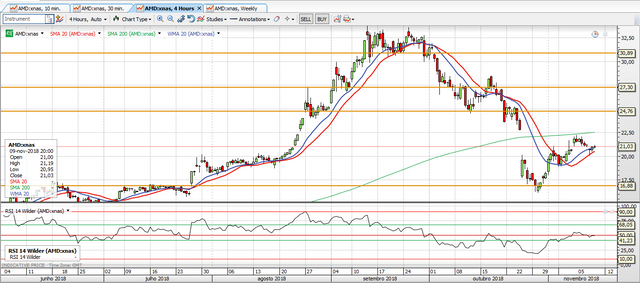 $AMD is a very exciting stock, because it's a stock with great fundamentals and products. The stock price already had two healthy pullbacks: the last one was a 3.54% pullback. So, this is my preferred and less risky stock among all.
In the image above I draw some support and resistance lines just for my reference. I think that due to the pattern we see on this stock (similar to a Pump&Dump stock, but this has fundamental reasons and it's not manipulated) I'll have to use Fibonacci expansions on the lower timeframes (like 30min) to calculate the price targets for a possible sell point.
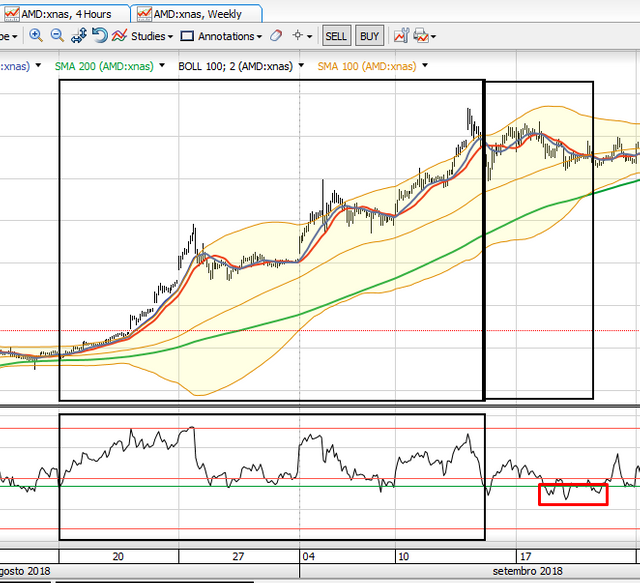
When it comes to the 14RSI, I'll present you with a different analysis. So, make sure you read and understand this paragraph. I'll explain this using the first image, so look at the first image. The green lines on the 14RSI represent support lines for a bull market instead of support and resistance, because this stock is different from the others. If you pay attention, when the stock rises it rises in two phases. The first phase is the weakest one and it tests multiple times the lower green line. Then, it goes to the second phase where it tests multiple times the higher green line. Although, the stock seems to rise at the same pace unless you zoom in. Now you want an example, right? Great, look at the three boxes to understand(This is the "perfect" example). After the boxes I draw there's another example.
Right now, the 14RSI is staying between these two lines but it didn't touch the support line yet, so be careful. Although we have 2 confirmation signals: price and 14RSI.
$AMD is a very exciting stock, because it's a stock with great fundamentals and products. The stock price already had two healthy pullbacks: the last one was a 3.54% pullback. So, this is my preferred and less risky stock among all.
In the image above I draw some support and resistance lines just for my reference. I think that due to the pattern we see on this stock (similar to a Pump&Dump stock, but this has fundamental reasons and it's not manipulated) I'll have to use Fibonacci expansions on the lower timeframes (like 30min) to calculate the price targets for a possible sell point.
When it comes to the 14RSI, I'll present you with a different analysis. So, make sure you read and understand this paragraph. I'll explain this using the first image, so look at the first image. The green lines on the 14RSI represent support lines for a bull market instead of support and resistance, because this stock is different from the others. If you pay attention, when the stock rises it rises in two phases. The first phase is the weakest one and it tests multiple times the lower green line. Then, it goes to the second phase where it tests multiple times the higher green line. Although, the stock seems to rise at the same pace unless you zoom in. Now you want an example, right? Great, look at the three boxes to understand(This is the "perfect" example). After the boxes I draw there's another example.
Right now, the 14RSI is staying between these two lines but it didn't touch the support line yet, so be careful. Although we have 2 confirmation signals: price and 14RSI.
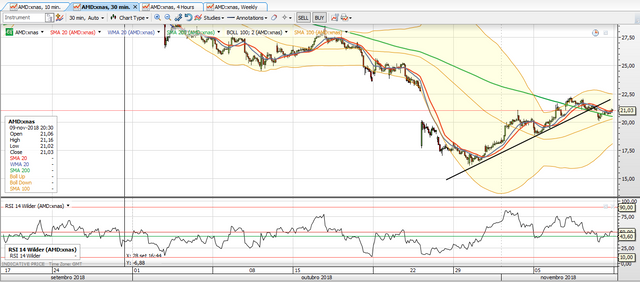 This is the 30min chart and like the other two stocks there's a break of pattern on the trend line. Also, the 14RSI is creating a support (green line). According to the historical data (the image below), the 14RSI usually respects this line when the stok is on a uptrend. When it's in a ranging market it breaks through this line. So it's a detail to watch closely.
 Stock alerts: $22.50, $18.50 and $17.50
5. $ONB: Old National Bangcorp
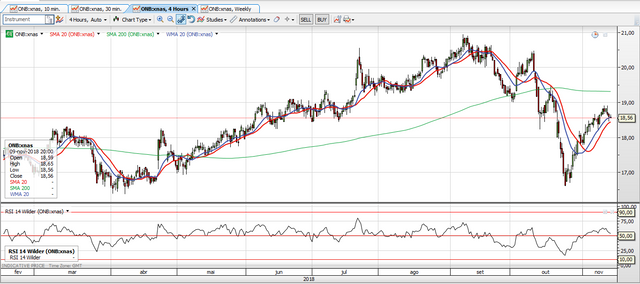 The image above is the 4H chart for $ONB. This stock is a little different and I'm not going to breakdown on the lower timeframe because it increased around 10.32% without a big pullback. So, I'll probably add this stock to my top stocks to watch for the next week.
Before going to next one, notice the fact that during strong uptrends the 14RSI respects the 50.00 line. Take a look at May, June and August.
Stock Alerts: $18.20, $17.80, $19.00 and $19.20
The image above is the 4H chart for $ONB. This stock is a little different and I'm not going to breakdown on the lower timeframe because it increased around 10.32% without a big pullback. So, I'll probably add this stock to my top stocks to watch for the next week.
Before going to next one, notice the fact that during strong uptrends the 14RSI respects the 50.00 line. Take a look at May, June and August.
Stock Alerts: $18.20, $17.80, $19.00 and $19.20
6. $SJI: South Jersey Industries, Inc.
Before even looking at the stock chart consider the fact that this company lost money during the Q3 earnings season (https://finance.yahoo.com/news/south-jersey-industries-3q-earnings-005137881.html). This puts the stock in the "risky" category. So, be careful.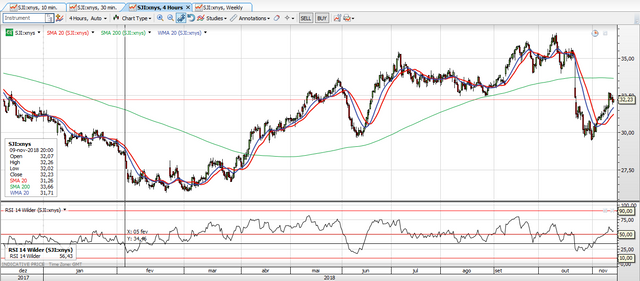
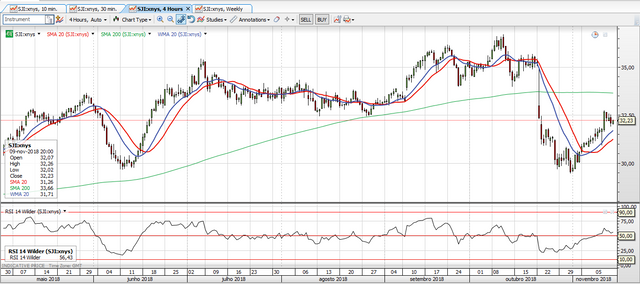 Again: the same 4H chart and the support line on the 14RSI is the 50.00 line, because when the stock started a strong uptrend in April and May the 14RSI respected the 50.00 level.
The stock is currently trading above the 50.00 level on the RSI and had a healthy pullback of 1.38%. Like $ONB it raised way too much without significant pullbcaks which is risky to me. I believe the pullback isn't over, so if I open a position, I'll probably open it in the end of the week or maybe next week.
Again: the same 4H chart and the support line on the 14RSI is the 50.00 line, because when the stock started a strong uptrend in April and May the 14RSI respected the 50.00 level.
The stock is currently trading above the 50.00 level on the RSI and had a healthy pullback of 1.38%. Like $ONB it raised way too much without significant pullbcaks which is risky to me. I believe the pullback isn't over, so if I open a position, I'll probably open it in the end of the week or maybe next week.
Thank you for reading this post!
Follow me for more content about technical analysis!
If you enjoyed this post feel free to upvote and resteem!
Click here to buy cryptos and receive $10!
Click here to get paid to search on web!
Congratulations @swingtrades! You have completed the following achievement on the Steem blockchain and have been rewarded with new badge(s) :
Click here to view your Board of Honor
If you no longer want to receive notifications, reply to this comment with the word
STOPDo not miss the last post from @steemitboard: