Market Analysis (S&P500) - 4/11/2018

Heyoo Stemian traders! What's going on guys?
I hope all of you had an amazing week. This is my first post (after the Disclosure post) and I'm going to analyse the overall market from a technical standpoint, but also in fundamental terms. I will focus mainly on the S&P500, but also the 10 year U.S. treasury rate because these two are correlated.
Firstly, why is the market so volatile?
As we all know, the volatility of the market comes from:
.The fear of the end of the debt cycle
.The fear of a trade war
.The fear of a new crisis (the institucional derivatives market might collapse, the dollar could become stronger to a point where companies in emerging markets can't pay off their debt, for example).
In addiction, another parcel was added to the equation: countries all around the world are dumping U.S. Debt. What is the result? Supply increases drastically (considering that demand stays more or less the same), prices of the U.S. bonds fall and interest rates for these bonds rise. the companies that need to issue new debt, might have to pay higher interest. This situation might lead to a correction in the stock market.
Check out this youtube video for more information:
Analysis of the Weekly timeframe (S&P500):
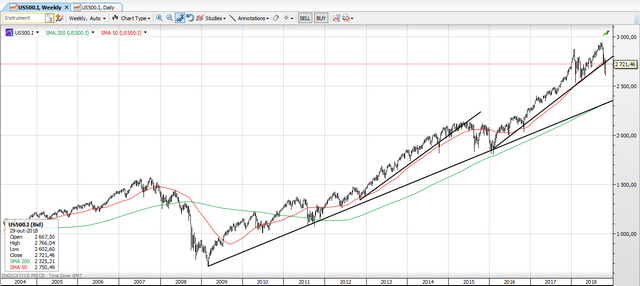
As you can see from this image, the major trend line that was established in 2009 and 2011 isn't broken yet. Although, since 2016, a sharper trendline was created and now it's broken. I think it's normal because the trendline was too steep. Besides, as you can see that happened in the 2015 "correction.
(Zoom in this chart or open it in a new tab: it's important to see the numbers)
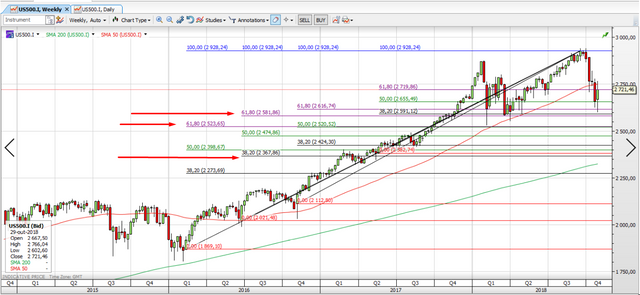
I know this 2nd weekly chart might seem confusing, but focus on the red arrows. These lines represent the confluence zones of various Fibonacci retracements, but I call them: price targets. They should be respected by the price (if the analysis is right). Also, these lines must contain different Fibonacci ratios: in the first case is the 61,80 (2581,86) and 38,20 (2591,12) ratios.
This week the price target of 2591,12 was hit (look at the low of this week).
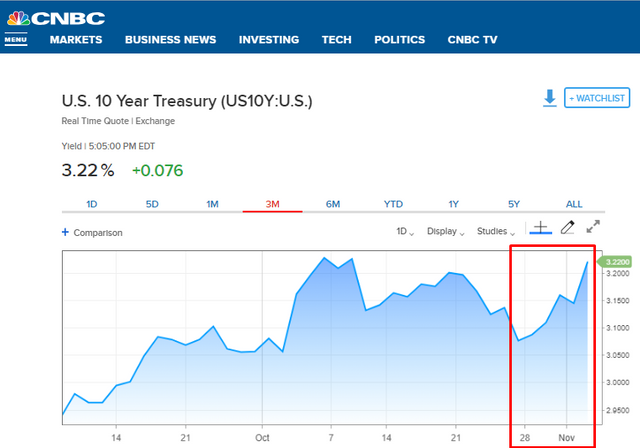
I expect a green week in the stock market, because the 10-year interest rate of U.S. bonds increased too much since 28th October and it tested the resistance level (3,20% - 3,22%), which means it will probably decrease or flatten by next week. Also, the price target I previously refered was hit so a rebound is expected.
Next Price targets:
.Between 2523,65 and 2520,52
.Between 2382,74 and 2367,86 - if the market breaks through this level, I think a correction will take place.
Analysis of the daily timeframe (S&P500):
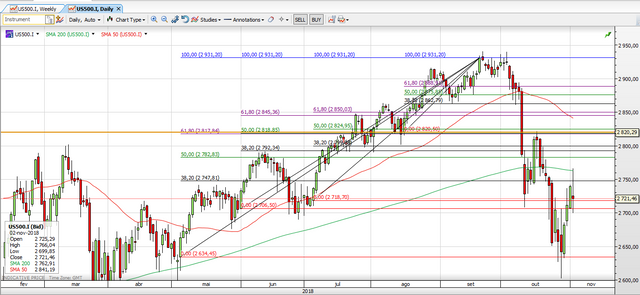
This timeframe is no longer relevant because the price targets are all above the price not below (and I want to find support for the price). That's why I focused so much on the weekly timeframe. Apart from that, look at the yellow line in the 2820 level: it has 3 fibonacci levels that were respected and are different (the 0,00 line at 2820,5; the 50,00 line at 2818,85 and the 61,80 line at 2817,84).
P.S.:I know that usually people post an introductory post to present themselves to the community, but I'm still creating that post. So, I will probably release it by the end of the next week. Because I'm so pumped to start creating content, I decided to start with this analysis. So, stay tuned to check my introductory post.
I don't own any securities mentioned above. Read my Disclosure.
Congratulations @swingtrades! You have completed the following achievement on the Steem blockchain and have been rewarded with new badge(s) :
Click here to view your Board of Honor
If you no longer want to receive notifications, reply to this comment with the word
STOPDo not miss the last post from @steemitboard:
Resteemed by @resteembot! Good Luck!
Check @resteembot's introduction post or the other great posts I already resteemed.
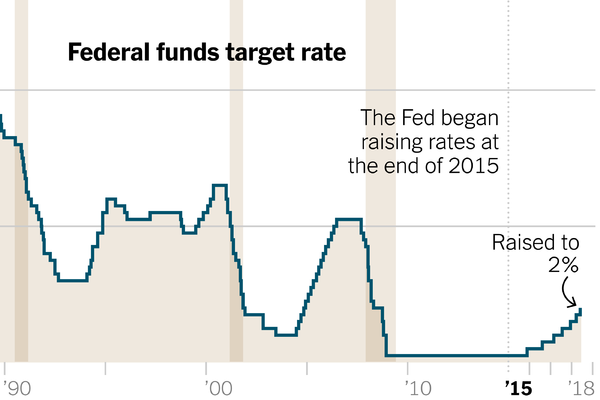
The Trump effect?
I would say: FED effect.
FED has been increasing interest rates since 2015, but that increase has become too steep this year (as you can see from the image below).
This increase in FED's interest rates leads to a decrease of the price of the bonds in general. And don't forget that these countries have billions and billions of dollars invested in bonds, so they lose a lot of money. This is a logical explanation to me, but there might be more reasons behind it.
I also think that the fear of a stronger dollar against other currencies leads to this type of behaviour
Feel free to resteem this post: I don't charge you any money XD
 short-term bonds)
@doctorcrypto I think you are interested in interest rates and U.S. Debt.
If so, check out my new post about the treasury dumpsters.
Let me know your thoughts in the comment section.
I think the market will collapse in late Jan or early Feb. Whats your though?
And welcome to Steem :D
Posted using Partiko Android
I don't know when. Actually, I don't focus on that.
I usually focus on main support and resistance areas. But as far as we see a rebound of the last price target I mentioned above, I consider it the start of a market correction (not bear market).
Also, don't forget the "January effect". USUALLY, this happens most likely due to the fact that managers (from hedge funds and investment funds) inevest those fat bonus received by the end of the year in the stocks.
Don't forget to resteem: it helps a lot and it's free XD
You are way more into it that I am hehe.
Didn't think about the Jan effect :D
But cool :D
Posted using Partiko Android
I think the market will collapse in late Jan or early Feb. Whats your though?
And welcome to Steem :D
Posted using Partiko Android
Congratulations @swingtrades! You have completed the following achievement on the Steem blockchain and have been rewarded with new badge(s) :
Click here to view your Board of Honor
If you no longer want to receive notifications, reply to this comment with the word
STOPDo not miss the last post from @steemitboard: