Market Analysis (S&P500) - 8/11/2018

Hellooooo steemian traders! What's going on? Hope you guys had an amazing day. In this post I'm going to make a quick market analysis.
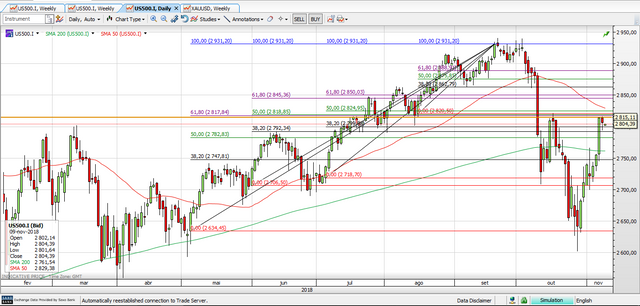
The image below shows my Fibonacci retracements on the S&P500 on the daily chart. When I talk about Fibonacci retracements I usually seek confluence levels: levels with at least 2 different Fibonacci numbers. The confluence zone between 2817,84 and 2820,5 (3 different Fib levels) was reached yesterday and rejected today. For tomorrow and the rest of the week I expect a strong pullback, because since 29th October we've been in a strong rally of 6,59%.
I don't own any securities mentioned above. Read my Disclosure.
Click here to buy cryptos and receive $10!
Click here to get paid to search on web!
This post was upvoted and resteemed by @resteemr!
Thank you for using @resteemr.
@resteemr is a low price resteem service.
Check what @resteemr can do for you. Introduction of resteemr.