STEEM Chart - Breakout to Consolidation - What Next?
Breakout to Consolidation
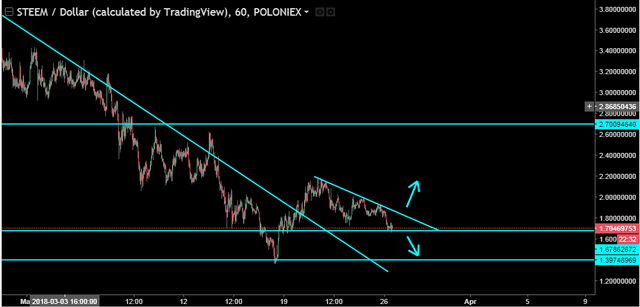
Well Well Well, looks like we got ourselves a good ol' fashioned consolidation.
As talked about in the last STEEM chart update, price FINALLY broke out of the long downards trend and into a consolidation pattern. While we didnt see any particular strong move towards higher highs, we have seen a nice triangle formation forming on the 1 hr, with the bottom being a strong support at the last daily low of $1.70.
Since we are looking at key levels, we could see a breakout towards the prior low, or a jump towards the next major resistance level of $2.20. The best point of entry is after a strong confirmation from a candle formation. The next move will most likely solidify whether the channel is at the current price or $1.70.
Great information.Thanks for sharing