Semiconductors Set To Outperform S&P? Bullish Indicator...
There are a number of charts in US equity markets that are suggesting a more positive outlook but one that catches my eye from a trading perspective is the Semiconductor Index.
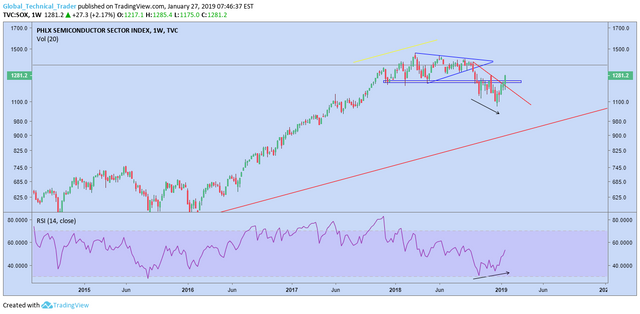
The chart above shows that price has regained a major level that initially broke in October when the S&P topped out. Also apparently is the bullish divergence which adds weight to a significant low being in place, especially with it occurring on the weekly time-frame.
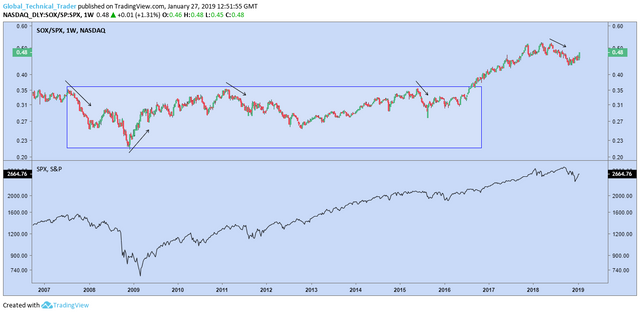
Whilst I need to see the index above ~1,360 (2000 highs) to be outright bullish, the first hurdle has been overcome. This is also a significant development for me as the chart below shows how important the direction of the Semi's has been to the broader risk environment, often acting as a leading indicator as the arrows indicate.
Last but not least, SOX vs SPX looks to have completed a failed breakdown, occurrences that typically lead to a violent move in the opposite direction.
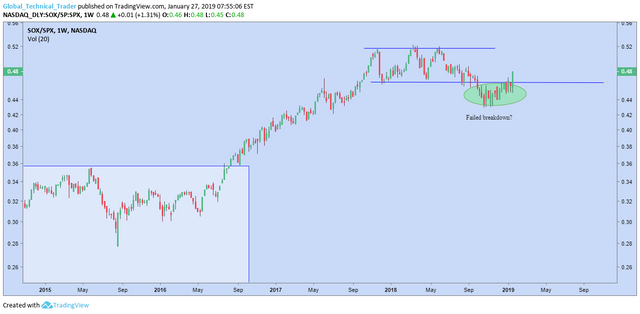
These charts give us clear levels to watch but for the time being, I'm happy to be trading on the long side.