US Markets: Risk Indicators To Watch; More Downside To Come?
There are a whole host of indicators and relationships that can be used to build a picture of underlying market strength or weakness. But right now, a few catch my eye for being at significant levels and may give us an insight to future market behaviour.
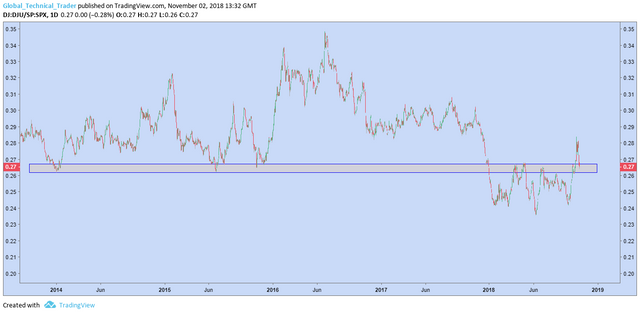
Above is the relative strength of Utilites vs S&P 500. When utilities outperform, its a sign that institutional money is acting in a defensive manner and therefore, asset prices tend to fall. This ratio is right back on support. A move higher from this level would suggest more weakness is in the cards. If it can penetrate this level to the downside, that would be a tick in the bullish column.
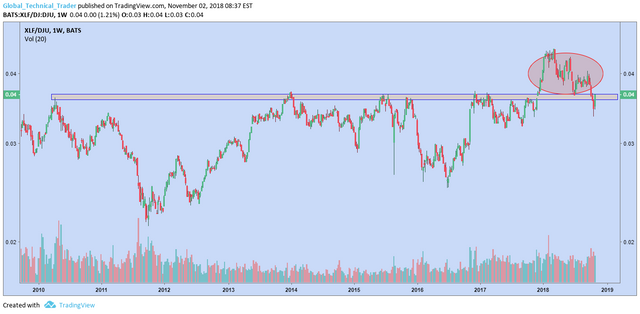
The next chart below is that of the Financials ETF, XLF vs Utilities again. The concern here is the huge failed breakout and financials moving back to under-performance vs utilities. In a healthy market, we'd like to see this move higher. If it can regain the area above resistance, we could turn a little more neutral. Should it continue to the downside, it would likely suggest more downside in equities in general.
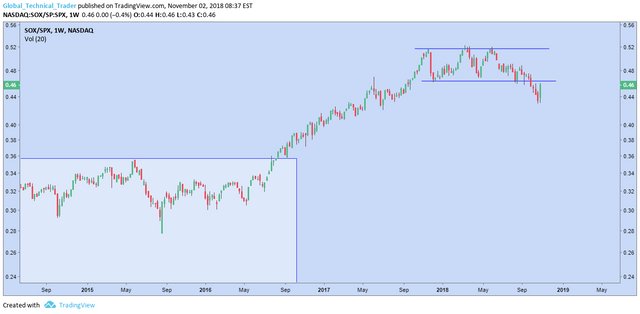
The Semi's have out-performed the S&P 500 throughout the bull market off the 2016 lows. A deterioration here was a significant negative event. Price is now pushing back up toward resistance from the breakdown area. Where to next is important to watch. I can't move back to a more neutral stance on Semi's unless this price ratio can sustain a move, at least back in to the topping pattern.
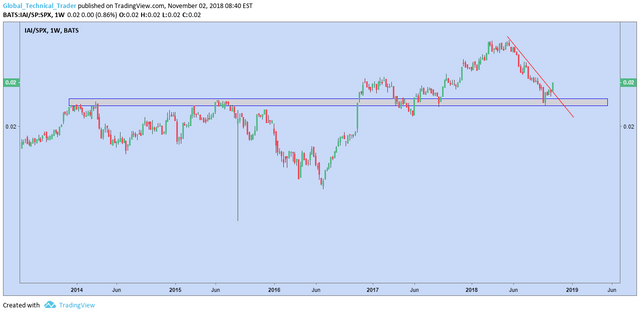
On a more positive note, the capital Markets ETF has managed to hold support and break above it's downtrend...
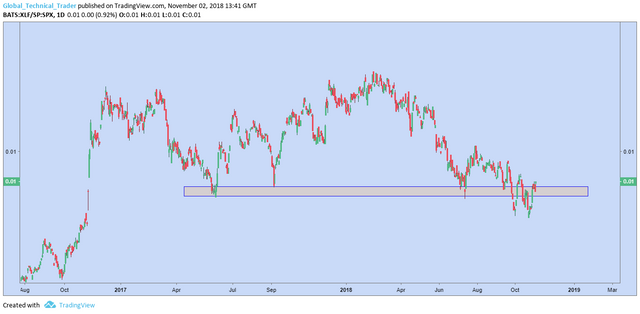
And XLF/SPX is clinging on to to it's range for the year.
Trading conditions remain difficult so best to mage risk accordingly and trade smaller and less often. For now, I'm happy monitoring relationships such as these to get a clue as to the next direction for markets.
However, given the number of failed breakouts and subsequent weakness in the US and major topping patters in equity markets globally as well as a host of individual names, I still feel further weakness is the most likely scenario with the burden of proof firmly resting with the bulls at this stage.