Dogecoin Breakout (DOGEBTC) - Nice triangle Formation
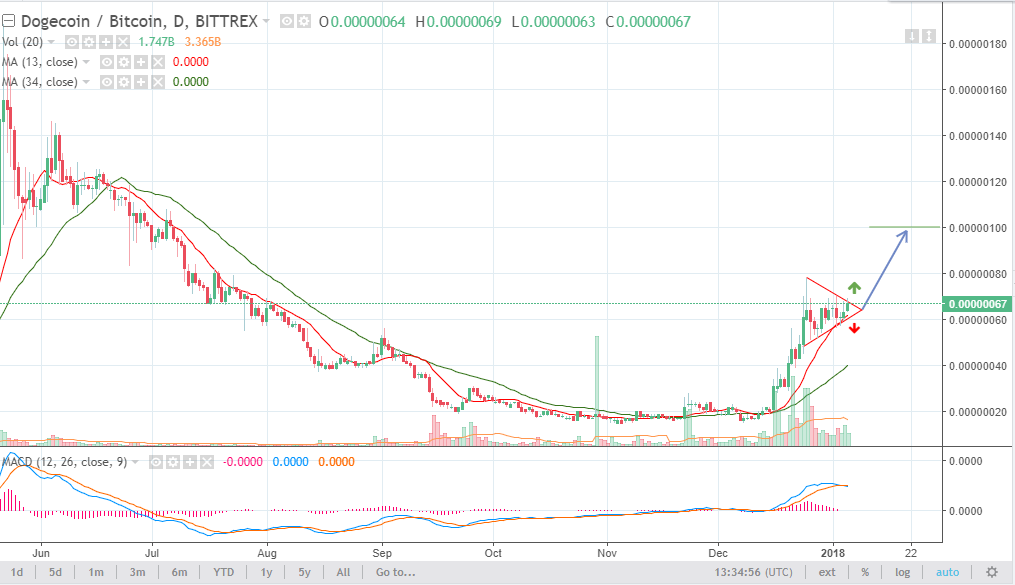
This is a Doge-Bitcoin trade. Dogecoin has formed a triangle on a 1 day chart and there should be a break out soon. This could be an upward or a downward break out but for an upward one, the profit target should be around 100sats per doge.
It is necessary for you to wait for the break out before entering a position (either buying or selling as the case may be). Also note that the profit target is based on the previous trend, so you can determine your own profit target, but do not get too greedy and stick to a plan. You should also know that market can change within a split of a second for any reason or factor, which one of them may be as a result of BTC being bullish, so be fast enough to adapt your trade to such situations like this.
Lastly, trade a certain percentage of your portfolio and never go all in.
I wish you the best in your trade!
Disclaimer:
This is my opinion, so you can decide to make further research which means everything you do is at your discretion and totally makes me not responsible for any loss on your part. This post is meant to be a guideline and you should see it as such.
OBSERVATION NOT ADVICE.
The MACD lines are converging, signaling a trend reversal (breaking down) and the histogram in the MACD is diminishing - refer to the RSI & see whether DOGE is under or over sold. This looks like it may break down not rise, check the oscillators.
If buying in, buy the breakout, set an entry at 0.00000080 and an exit higher (determine your own exit). 😎