BITCOIN Can Follow This Path 2014 and 2018! Put Your Tin Hat.
Yesterday D4rkEnergY showed you a comparison between the price movements in 2014 and 2018, which had some scary similarities! To follow up on these charts, I decided to make some calculations and used some Elliott waves combined with Fibonacchi levels to see, how Bitcoin -5.32% would move if we would continue to follow the 2014 path.
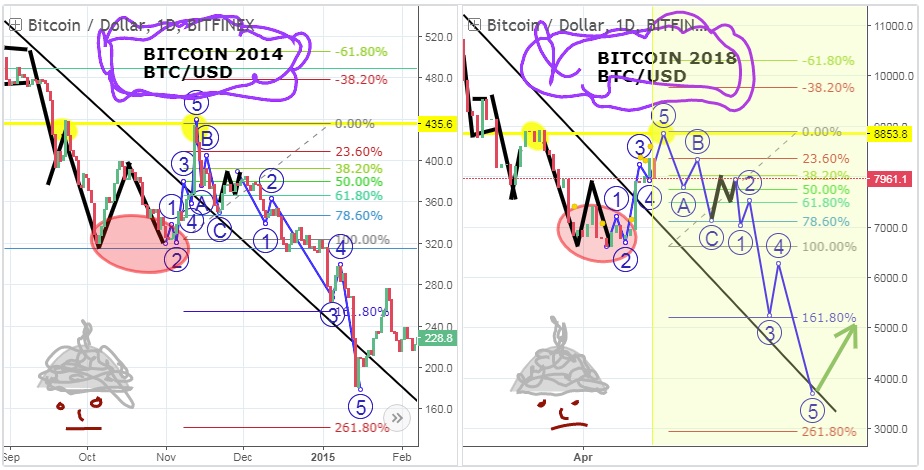
On the charts we are looking at right now, I have zoomed in to take a closer look at the current action. Both charts show, that we came down via a bear flag , had a smaller correction to the upside and then the double bottom (red circle).
After that we went trough the downtrend channel with a massive spike with huge volume .
I've calculated the increase in price, and counted the Elliott Waves and used the before mentioned Fibonacci levels on the 2014 and applied it to the 2018 chart to see, where we might be heading.
Last but not least! I want to stress, that this is not, what I necessarily think is going to happen. I am for now - still bearish - and I think we will go lower, BUT I'am still SUPER BULLISH on Bitcoin -5.30% in the long run. And I am convinced we will see a new All Time High before 2019.!
Source
@amzadlak @Steemitchain @Cryptocoinbull
#Follow #Vote #Comments #Bitcoin #Cryptocurrency #Steem #Steemit #Steemchain
i think bitcoin will be go down 4000$ to 2500$ Than Bitcoin Strongly back more than 50K up just hold every body your btc.
all market system follow up and down. i hope the market recovery and all investator recovery there invest money with benefit.