Tron (TRX): Is This the Time to Take BUY or Profit SELL?

SUMMARY
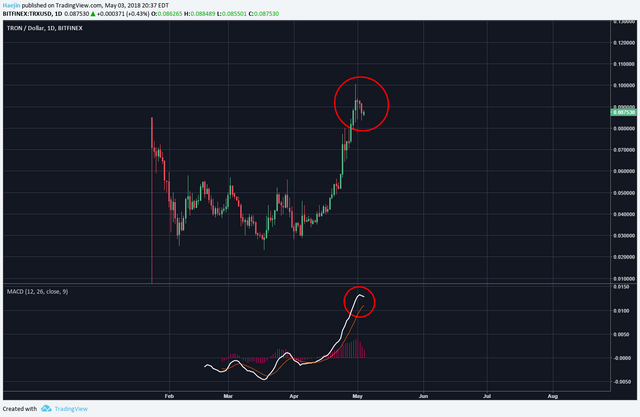
Price & Indicator: For traders, the below chart should contain a thousand words. The red circles indicate an overbought status. Even if price goes incrementally higher, the overbought status will only deepen. Would this be the time to be taking BUYING or SELLING actions?
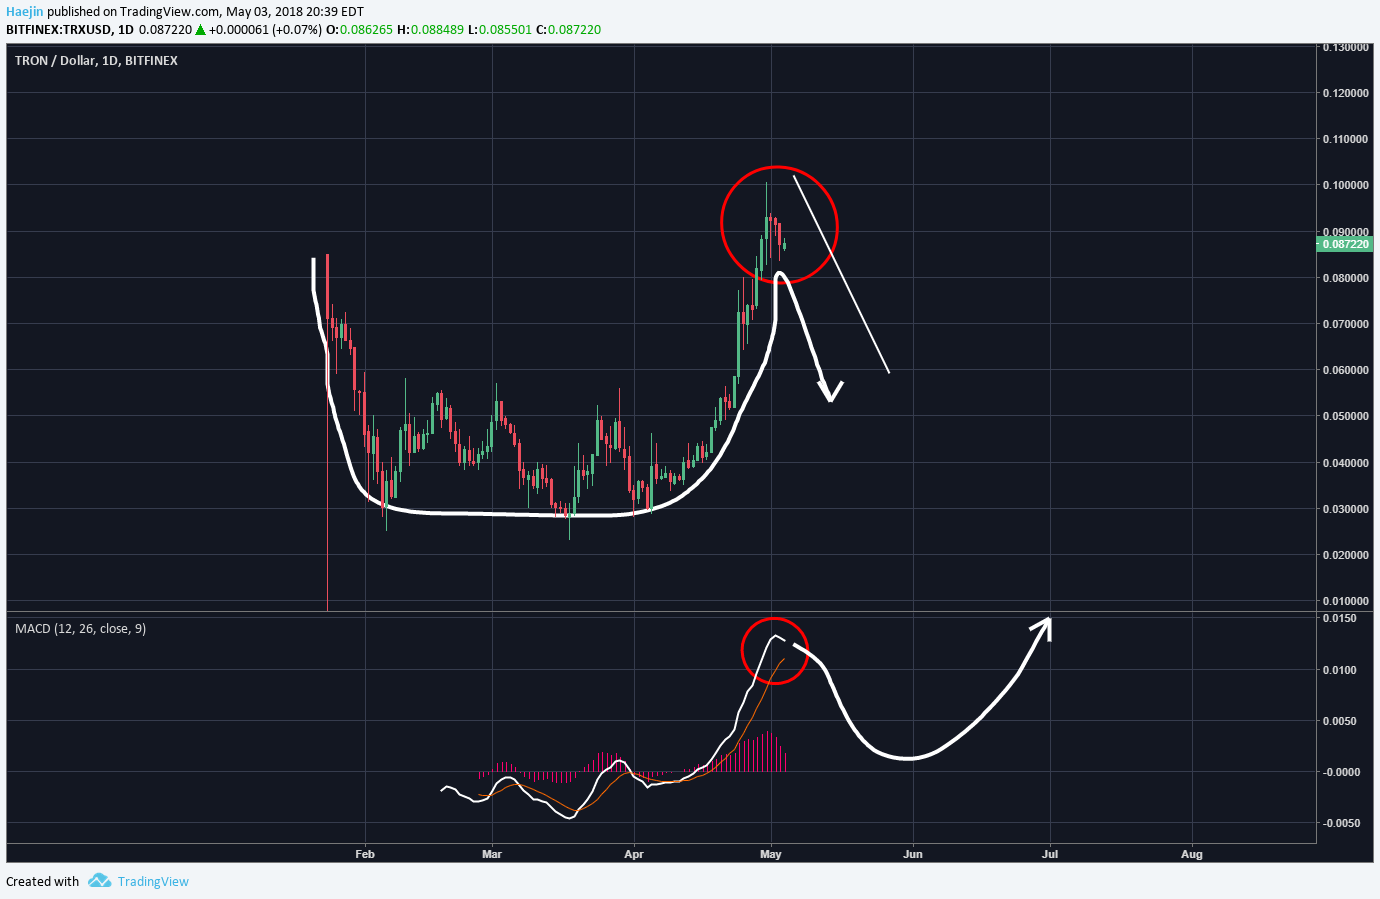
Price, Indicator & Pattern: I've now included the rounded price formation. IF this is a CUP & Handle being patterned out, then it's likely that the handle formation will commence. So, thus far, price, indicator and pattern are jiving.
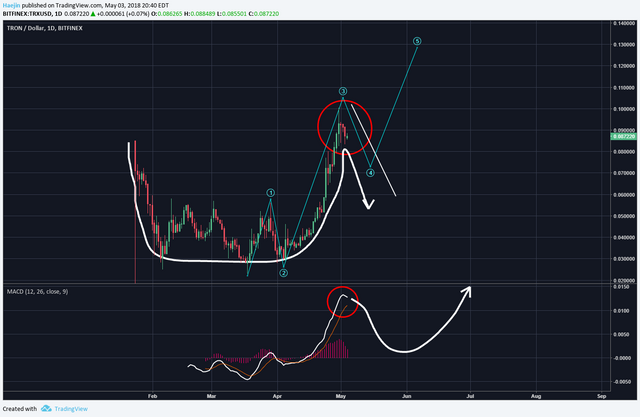
Price, Indicator, Pattern & Elliott Waves: IF the impulse wave shown has it so that waves 1,2, and 3 are complete; then wave 4 needs to take place. IF the handle formation and wave 4 coincide, then a correction is to be expected. So, would this be the time to be taking BUYING or SELLING actions? Such must be a self made decision. However, I do hope that this analysis can help augment your due diligence.
Legal Disclaimer: I am not a financial advisor nor is any content in this article presented as financial advice. The information provided in this blog post and any other posts that I make and any accompanying material is for informational purposes only. It should not be considered financial or investment advice of any kind. One should consult with a financial or investment professional to determine what may be best for your individual needs. Plain English: This is only my opinion, make of it what you wish. What does this mean? It means it's not advice nor recommendation to either buy or sell anything! It's only meant for use as informative or entertainment purposes.
Please consider reviewing these Tutorials on:
Elliott Wave Counting Tutorial #1
Elliott Wave Counting Tutorial #2
Elliott Wave Counting Tutorial #3
Laddering and Buy/Sell Setups.
Laddering Example with EOS
Tutorial on the use of Fibonacci & Elliott Waves
@haejin's Trading Nuggets
Essay: Is Technical Analysis a Quantum Event?
Follow me on Twitter for Real Time Alerts!!
Follow me on StockTwits for UpDates!!
--
--


take profits
This haejin post has been downvoted, it is a @flagtarget.
READ: Resteeming @haejin's 8th 9th and 10th post of the day as target to be flagged.
They resteem 3 of @haejin's posts a day, and we concentrate our efforts on removing the potential rewards from those three.
Then @flagfund pays "The Braves" who flag those 3 posts every day, as you can see their posts are doing quite well.
Wave 4 is looking 5 wavish. Sell order at 950 sats on wave 4 of 4 and scoop them back up on wave 5 of 4 around 760 sats to ride out wave 5 higher degree of trend to around 1350 sats. Possibly. :)
This haejin post has been downvoted, it is a @flagtarget.
READ: Resteeming @haejin's 8th 9th and 10th post of the day as target to be flagged.
They resteem 3 of @haejin's posts a day, and we concentrate our efforts on removing the potential rewards from those three.
Then @flagfund pays "The Braves" who flag those 3 posts every day, as you can see their posts are doing quite well.
Post your chart!
definitely better entries for TRX coming soon! Take profit keep buying more!
i'm waiting~~
Yes true your opinion. an imformation that you give and consideration must be there and konaultasi with experts it is very important.in doing transactions we need to be careful.
Ascending triangle about to break on the 1-hr chart. Looks like the bottom might be in to me. I ain't sellin' now.
oh god! just sold! thanks
I only have a little invested. So I'm just watching and trying not to get too stressed out about it.
Sangkira katem vote sigoe sapoelamoedi sonoe.... Maka askn keut takeurja hai thk @haejin
Please @haejin do an update on bitshares (Bts)