Lightbulbs popping off... OTC:LIBE idea

New idea for this market...
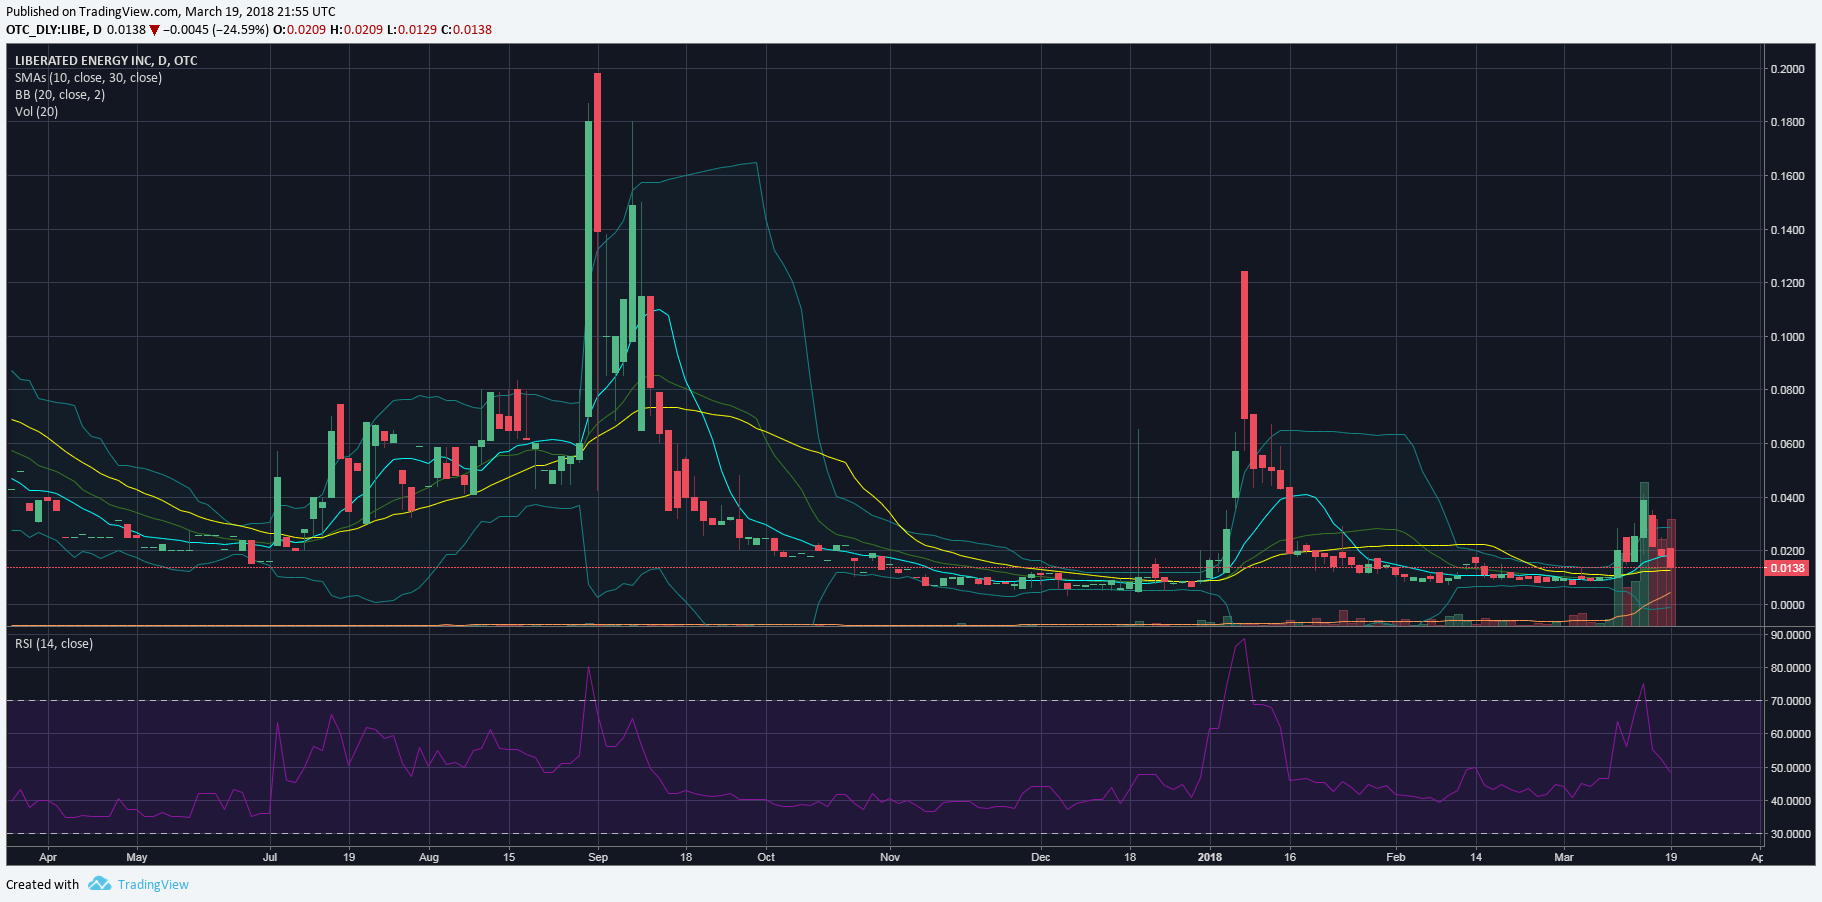
1 year chart doesn't look so appealing...
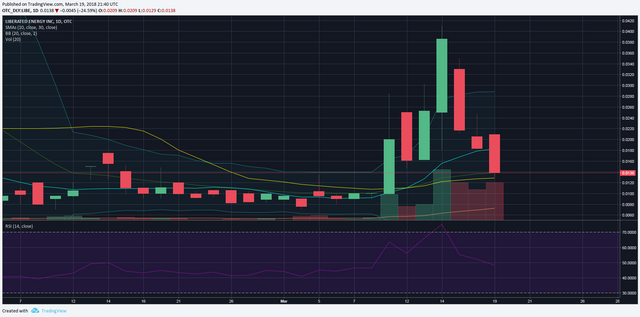
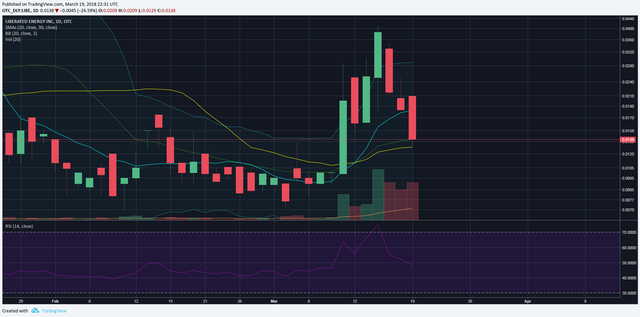
But if we take a closer look, there just may be an opportunity starring us in the face...

First thing we noticed was the volume, that can't be ignored... but notice that the price is hovering around that yellow line, our 30 day moving average...
Now switch our averages to 50 day and 200 day... Notice how the price was rejected after it surpassed the 200 day moving average (red line) then continued to fall through the 50 day moving average (yellow line)
The next most likely spot to get a bounce from would be our 30 day moving average or a previous resistance/support on the chart... which looks to be around .0130...
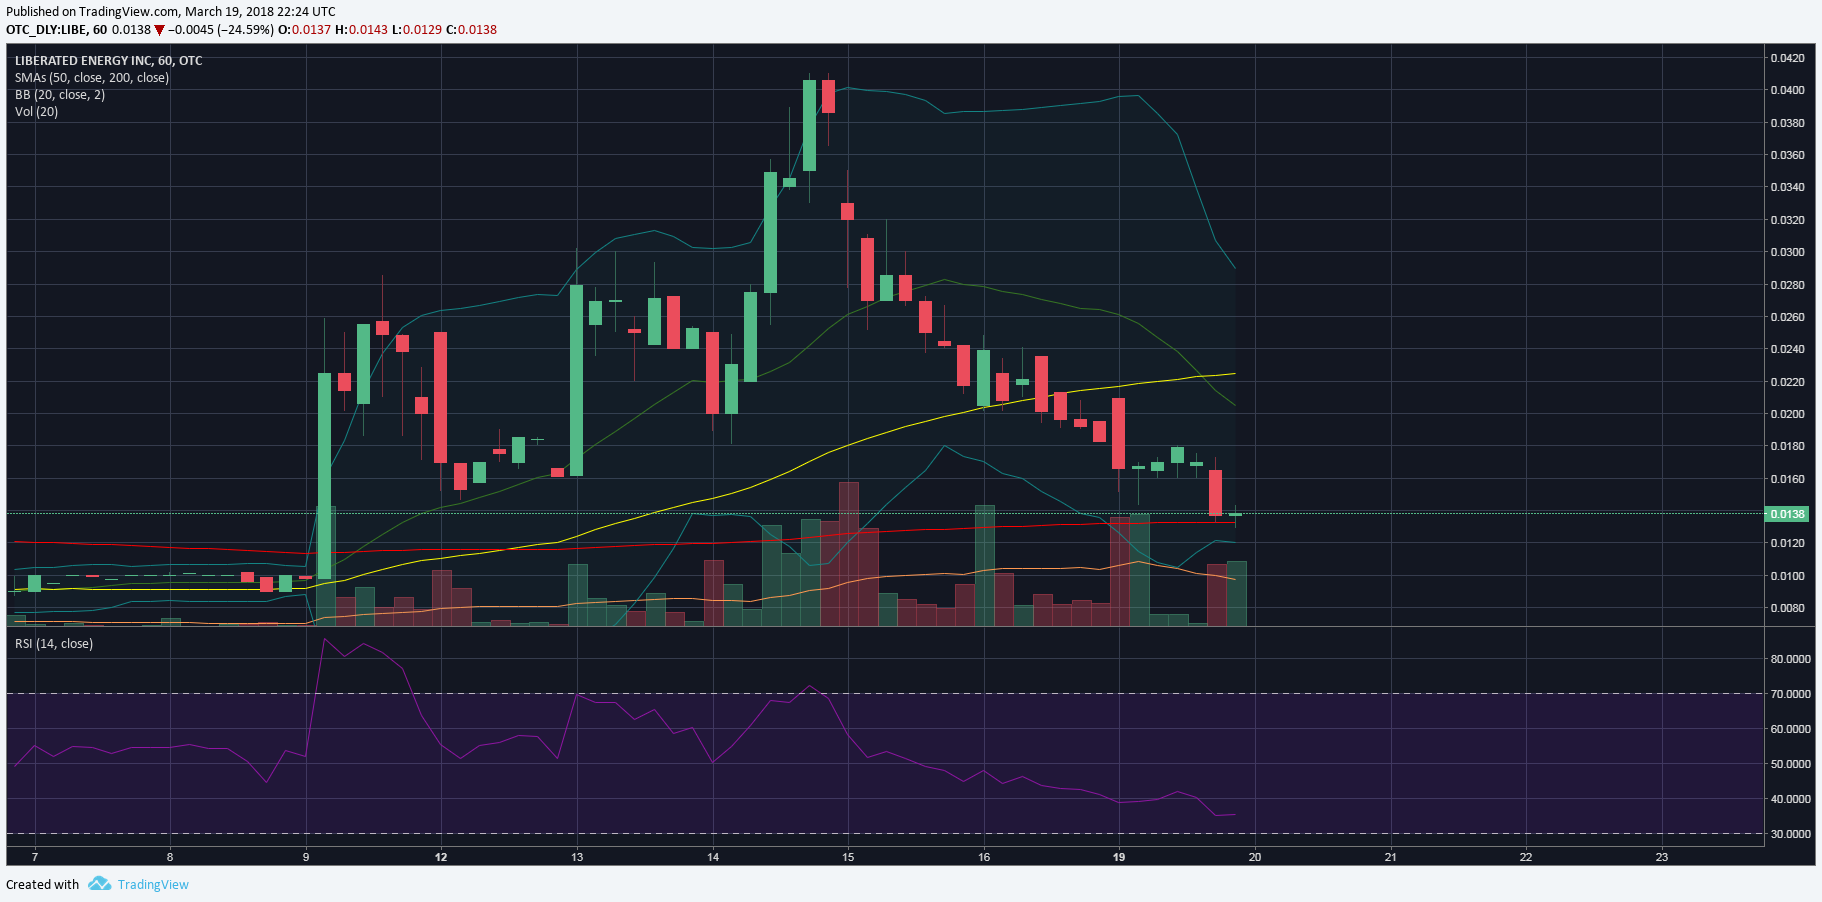
So comes the idea... let's monitor this trade in hourly format... Note how our moving average lines change on this format... These seem to still play a roll and for this trade, the red line triggers our buy, and the yellow line triggers our last sell if all goes as planned...
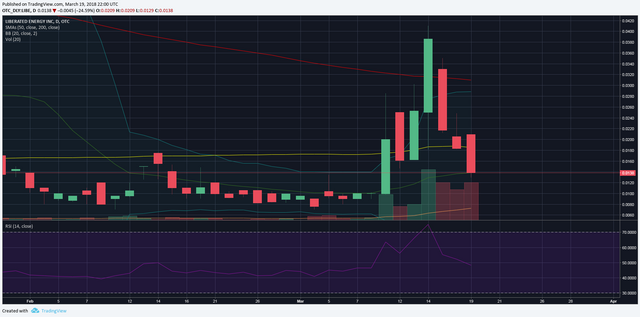
While monitoring the trade in hourly format, we will keep an eye on the daily as well... anticipate some resistance around our 10 day moving average and mark that our first profit taking zone if our stop doesn't trigger...

Must I say... this is not financial or trade advice... Just a perspective on the market... It is recommended that one does their own due diligence before purchasing any asset...
Good luck to you, thanks for looking and happy trading!