Analysis of Steem Voting Behavior
Motivation
I came across a really interesting post performing natural language text analysis on steem posts. While the natural language analysis is really interesting, it's not really in my area of expertise and I'll gladly leave it to @morningtundra.
Vote Time Analysis
What I want to present is a brief analysis of voting patterns in the steem community. Specifically we'll be looking at the time votes are made relative to the time posts are made. This should be interesting for new or experienced content creators to see what kind of performance they can expect for their post after a certain amount of time. For example, if a typical content creator notices that after 3 days their post has 30 upvotes, what they can expect at the end of the 7 day monetisation period? Or, stated differently, does the post still have much more room to grow? Additionally we'll observe what appears to be the impact of voting bots and other vote automation systems. I'll provide some figures (and code to support them) and analysis that will help a creator answer those questions. I include a lot of code in this post (don't worry you won't need to understand it) and I hope that readers can use this as a jumping off point for their own steem analysis using Python.
Background
I used the steemdata library available in python to collect the data used in this post. steemdata connects to steemdata.com using it's public MongoDB server and abstracts all the database accesses to simpler python. A big thanks to @furion for making and releasing this free tool! Python was also used to perform all the following analysis.
Process
Imports
import numpy as np
from matplotlib import pyplot as plt
import steemdata
import datetime
Obviously for any kind of analysis numpy (a scientific computing library) will be used. For this post I didn't do any real heavy analysing so don't worry if you're not a numpy expert. matplotlib.pyplt is used for all the figures (as plt). The other two should be self explanatory.
Data
As mentioned above, data was downloaded using the steemdata library, an example query is shown below:
sd = SteemData()
top_posts = list(sd.Posts.find(conditions,
                              projection = desired_fields,
                              sort = [('curator_payout_value', -1)],
                              limit = 500))
We now have a list containing the top 500 posts. You may notice the code above has some weird variables.Conditions specifies that we need to look at data from the last 30 days (collected at the beginning of February 2018, so this data represents January 2018). The desired fields are the parameters that we'll be looking at for today's analysis, namely:
active_votes: the votes on the posts, which itself has a number of parameters with the only one we care about being thetimefieldcreated: the creation time of the post in GMT
We'll look at the top posts in terms of curator_payout_value I felt that this would be the best reflection of what is most valued by the steem community and most likely to be seen in Trending. For this analysis we'll look at the top 500 posts.
Using these post we'll look at the steem communities voting habits in regards to time.
desired_fields = {'active_votes': 1, 'created': 1, '_id': 0}
time_constraints = {
    '$gte': datetime.datetime.now() - datetime.timedelta(days=30),
}
conditions = {
    'created': time_constraints,
}
Helper Functions
I made up a few (admittedly ugly) helper functions for analysing vote time relative to post time. Don't read into them too much unless interested, they do basically what their names suggest.
# Convert the timestamp from a steem post into a datetime object
def to_datetime(str_date):
    return datetime.datetime.strptime(str_date, "%Y-%m-%dT%H:%M:%S")

# Given a list of votes, return a list of voting times
def extract_times(votes):
    return list(to_datetime(v['time']) for v in votes)

# Given a post return all vote times relative to the post time
# The scale parameter is the number of seconds in the unit we want to use
# so the default of 3600 * 24 is 1 day (3600 sec/h * 24 h/day)
def relative_times(post, scale = 3600 * 24):
    times = extract_times(post['active_votes'])
    return list((time - post['created']).total_seconds() / scale for time in times)
To actually see the time distribution I first extracted the relative delay from when a post was created to when each upvote was registered. I then used the numpy histogram function to get the number of upvotes in a given time period for each post. I used 30,000 bins which roughly corresponds to 1 minute per bin, which means that the y-axis is showing the number of posts that happened within an ~1 minute period. This value was arbitrarily chosen and therefore the values on the y-axis shouldn't be overly analysed beyond their value relative to other points in time. Finally the actual plot function is called here, if you're wondering why it's so funky that's because histogram returns the contents of the binning, and the actual bins used in that order. We plot the bins hist[1] on the x-axis and the contents hist[0] on the y-axis. The reason we need to add a 0 to the beginning of the array is so that the plot rightfully starts at 0 (this is a simplification because sometimes authors upvote their own posts, but since this is a purely cosmetic fix I decided to allow the slight inaccuracy). Here is the generated graph, note that the the each different colour represents a different post, and all 500 are overlayed on one graph.
for post in top_posts:
    relatives = relative_times(post)
    hist = np.histogram(relatives, bins = 30000)
    plt.plot(hist[1], np.hstack((np.array([0]), hist[0])))
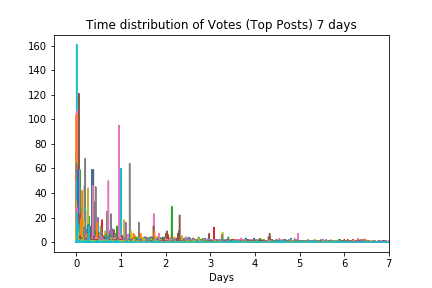
As you can see, the bulk of upvotes happen in or around the first day after posting. While you can see a few spikes after this and a long tail of upvotes it's obvious that the first day is the most critical. But how critical, let's adjust the scale of the plot and try again.
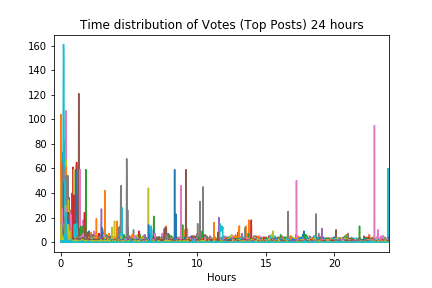
Although we went from 7 days down to 24 hours, the graph doesn't look much different. Again there are posts that seem to stand alone with spikes, but the bulk of votes still seems to be happening in the first ~2 hours. This tells us something important about timescales, if the appropriate one isn't used you'll miss out on a lot of valuable information. Let's adjust the scale again and look at just the first 2 hours.
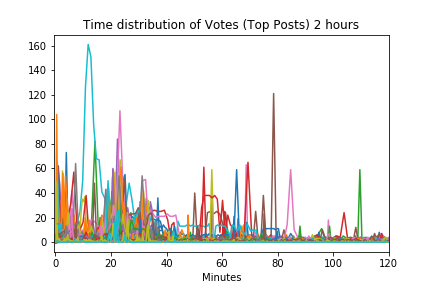
Here we can distinctly see the voting trends. Again the votes seem to come in toward the left of our graph and it seems that the densest in the first 40 minutes. If you look closely around the 40 to 60 minute range you can see many posts with wider comment distributions, rather than just spikes. My guess is that these posts have more organic upvotes as opposed to the posts with larger spikes (likely from curation trails or bots).
Probability Distribution of Vote Times
To finish off I wanted to calculate the probability of one of the top 500 posts receiving an upvote at different points in time. To do this I created one large array of vote times relative to their respective posts. Rather than manually calculated these values, I again used a histogram, but used the cumulative and normed flags. cumulative means that every bin represents the total number of votes on a respective post at that point in time. normed normalizes the data so that each bin is the proportion of votes at that point in time, this means the plot will rise until it reaches 1.0. Here is a sample of the Python code that achieves this.
plt.hist(all_relative_times, bins = total_hours, cumulative = True, normed = True)
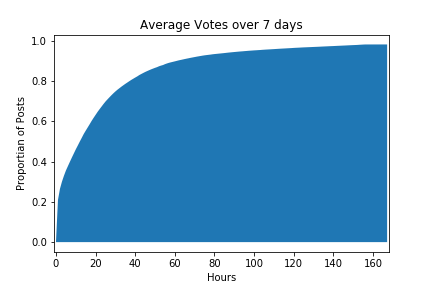
And here it is. As you can see the graph has already reached ~0.6 around the 24 hour mark. This means that on average top posts receive 60% of their votes in the first day. At this point the increase in votes slows and you can see the total votes crawl towards 100% and almost reach it at the 7 day mark (of course some people vote for posts after the first 7 days but it's rare and not shown in this graph). You may be able to see the sharp line around at the beginning of the graph, let's look a bit closer at this graph to see the time distribution of posts in the first hour.
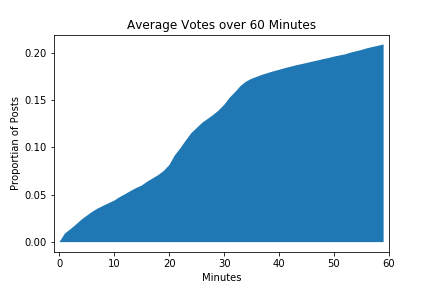
Interesting! 60% of the votes happen in the first day and 20% of those are in the first hour after posting! From this graph we can see that there is a steeper section from about 20-30 minutes and the voting slows quite drastically around the 30-40 minute mark. Could this be from upvote bots? It would make sense for them to be clustering upvotes at the end of the 30 minute split reward window in an effort to maximise their own curation rewords. You can see that 10% of the total votes happen in this ~10 minute window, very unlikely without the use of various vote boosting methods.
Conclusion
It's clear that there many of these posts are using bots or curation trails (seems less likely than bots) to give themselves an initial boost of upvotes or independent bots are farming top users for curation rewards. Overall these top posts still seem to be getting a large number of organic votes so it's not immediately clear if the use of bots is promoting content that the community might not actually want to see. I hope this post was informative and that others can draw more accurate conclusions based on what was presented above. If you have any questions or comments, feel free to leave them below and I'll gladly reply.
I'd like to continue this analysis in the future by actually taking a look at who is voting in these spikes (i.e. can we link the spikes to obvious bot accounts or known curators?) and other behaviours of voters.
Posted on Utopian.io - Rewarding Open Source Contributors
Thank you for the contribution. It has been approved.
Hi @calebjohn, welcome to Steem, Utopian and #blockchainbi - you've made a good start! :)
I agree that the large spikes are likely from a "big vote" (either bot or human) plus a large number of trailers. It's interesting to see that the top 500 posts still receive quite a
lot of votes after day 1. In my experience the vote rate stops much earlier for "regular" / non-trending contributions.
You can contact us on Discord.
[utopian-moderator]
Hey @crokkon, I just gave you a tip for your hard work on moderation. Upvote this comment to support the utopian moderators and increase your future rewards!
Thanks!
That is curious, maybe they're trying to boost themselves after failing to gain traction early on? I also see these as more likely to be the result of curation trails, a stray comment with an unfortunate amount of weight behind it.
I would love to see some of your analysis more here ! Thank you, it's very entertaining that you actually presented this neatly. Heads up !
A nice well explained analysis. Even for non-Python speakers. Thanks for sharing👍🏽
Hey @calebjohn I am @utopian-io. I have just upvoted you!
Achievements
Community-Driven Witness!
I am the first and only Steem Community-Driven Witness. Participate on Discord. Lets GROW TOGETHER!
Up-vote this comment to grow my power and help Open Source contributions like this one. Want to chat? Join me on Discord https://discord.gg/Pc8HG9x
Wow nice breakdown. I love that you inserted the python code you used in here. It will definitely help anyone who is interested in doing something like this.
Congratulations @calebjohn! You have completed some achievement on Steemit and have been rewarded with new badge(s) :
Click on any badge to view your own Board of Honor on SteemitBoard.
For more information about SteemitBoard, click here
If you no longer want to receive notifications, reply to this comment with the word
STOP