Developed a Dashboard of Charts using DC.JS
Hi, we had started a series of tutorials on uotpian.io about dc.js library . In the tutorials we taught how to use the dc.js library in order develop charts for your data. Now at the end of the tutorials, here we developed a dashboard of different charts. These charts are well connected to each other that you can easily filters your data with the help of these charts.
You can download it from Github
The dashboard helps you in developing chart, how you can implement the dc.js library in your project to develop charts for your data. In the dashboard charts we use a restaurant payment transactions data to develop the chart on our dashboard.
Here you can see our project,, its only just a starting point. In future, we are going to develop in to a Big charting Application for web and mobile platform.
If you take view of the the project ...
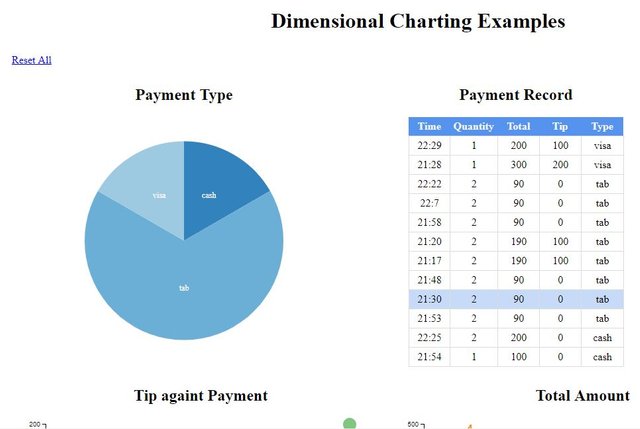
Here you can seethe pie chart and data table, under these chart there are also other chart.
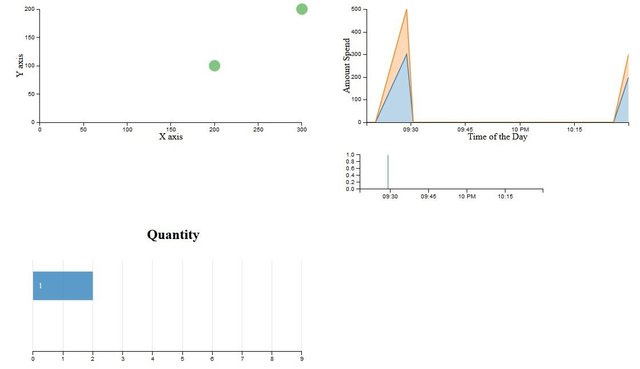
The charts are fully connected to each other when you filter the one chart it filters all the other charts. As you can see in the following diagram, we click on the the visa payment type, it automatically filters the other charts for us.
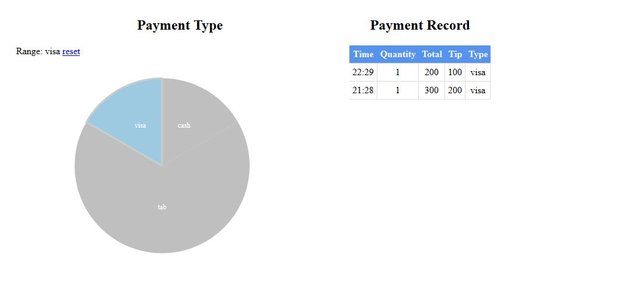
The data table only shows the record in which the payment done via visa. Same thing done with other charts.
Projects Details
- What is the project about?
Here we developed a chart dashboard using dc.js library, this allow you to visualize your data in the different charts. We use here some dummy data to visualize our chart you can use your own data in place of dummy data.
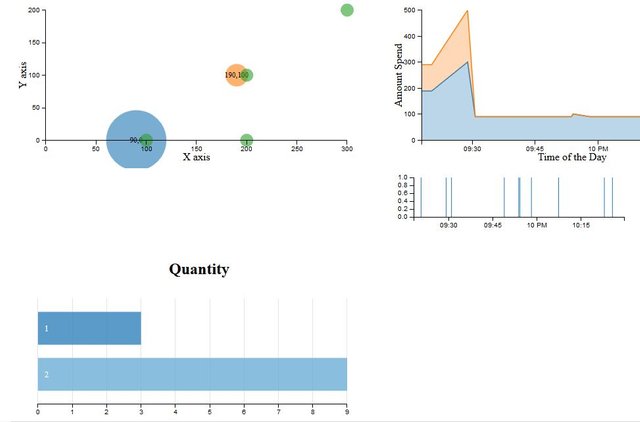
The dashboard contains following charts....
- Data Table
- Pie Chart
- Bar Chart
- Bubble Chart
- Range Chart
- Line Chart
Technology Stack
- HTML and CSS
- JavaScript Libraries
- dc.js
- crossfilter.js
- d3.js
- Roadmap
If we talked about our future plans, We want to develop this project toward Model Driven Development in which you just have to drag and drop in order to develop your charting dashboard.
You just upload your data in json or csv format, and there are different chart options available for you to develop charts for your data.
- How to contribute?
Send us email at [email protected] in order to contribute in the project. You can also do this by send a pull request on github.
Posted on Utopian.io - Rewarding Open Source Contributors
Your contribution cannot be approved because it does not follow the Utopian Rules.
You have uploaded whole repository at once and its very hard to evaluate the work done. Please try to maintain an active commit history so that we can evaluate the work done.
You can contact us on Discord.
[utopian-moderator]