Tutorial #17 Dive into DC.JS a JavaScript Library - Range Series Chart
What Will I Learn?
- Develop a Range Series Chart
Requirements
- Basics of HTML and CSS
- JavaScript Essentials
- Know the use crossfilter.js and d3.js
- Knowledge about statistical data
Difficulty
- Intermediate
Tutorial Contents
- Introduction
- Create Working Environment
- Develop a Range Series Chart
Introduction
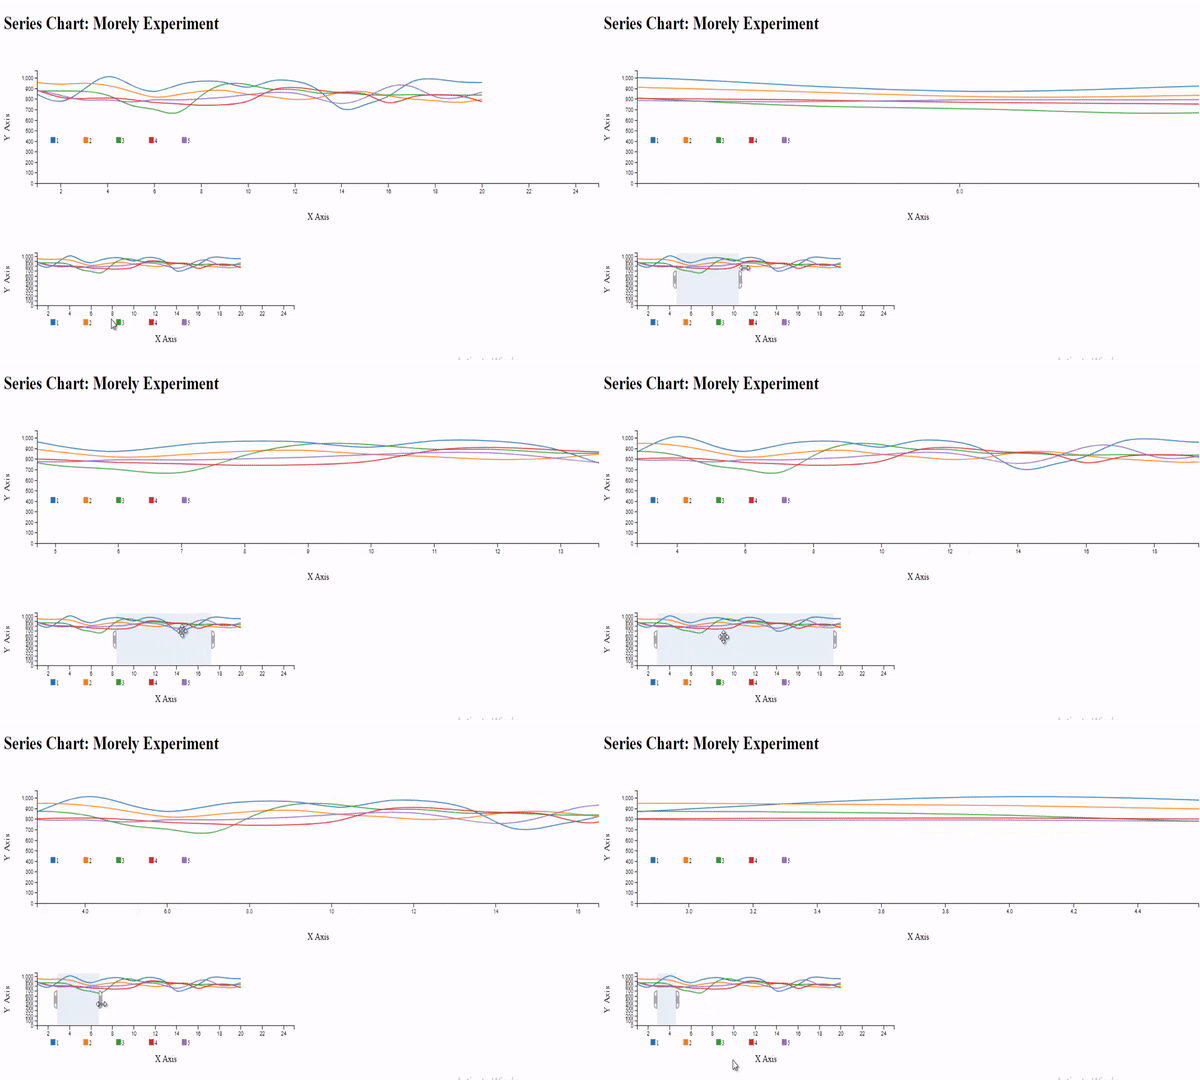
Today we are going to develop a Range Series Chart using dc.js library. This will be developed using filter([]) method of dc.js . We will use series charts, one will be the range chart and the other will be the focus chart.
For our chart we use Morley Experimental data in csv format. You can download it from github . Here is the final output of our range series chart.
Create Working Environment
First of all we'll create working environment to work with dc.js. For this open your text editor, create a new file and save it with name rangeSeries.html. Now write all the necessary code for the HTML file. Write this code...
<!DOCTYPE html>
<html lang="EN">
    <head>
      <meta charset="utf-8">
      <title>Series Chart</title>
    </head>
    <body>
    </body>

</html>
Then link your dc.js library to your files and also other two libraries dc.js depends upon, crossfilter.js and d3.js.
      <script type="text/javascript" src="https://cdnjs.cloudflare.com/ajax/libs/d3/3.5.1/d3.min.js"></script>
      <script type="text/javascript" src="https://cdnjs.cloudflare.com/ajax/libs/crossfilter/1.3.12/crossfilter.min.js"></script>
      <script type="text/javascript" src="https://cdnjs.cloudflare.com/ajax/libs/dc/2.1.9/dc.min.js"></script>
      <link rel="stylesheet" type="text/css" href="https://cdnjs.cloudflare.com/ajax/libs/dc/2.1.9/dc.min.css" />
Now write the code to give heading to our page and also write the div for our charts.
        <h1>Series Chart: Morely Experiment</h1>
        <div id="seriesChart"></div>
        <div id="seriesChart2"></div>
Develop Range Series Chart
Now its time to move toward our chart, first create two objects of of seriesChart class, and pass them the ids of the div we developed above.
        var seriesChart = dc.seriesChart("#seriesChart");

        var seriesChart2 = dc.seriesChart("#seriesChart2");
Now take your csv file and paste it in your working directory. To use the data from a csv file, we'll have to parse it first. This can be done through d3.js, this library give us a method csv([]) - allow us to parse the csv file.
            d3.csv("morley.csv", function(error, exp){
                     // the rest of the code will be written here ...
});
As I already written about the cvs method, it returns the data in string, this creates a problem for a numeric data. We've to do type conversion. Write this code to do this ....
            exp.forEach(function(d){
                d.Speed = +d.Speed;
                d.Expt = +d.Expt;
                d.Run = +d.Run;
            });
Now feed the parsed data to the crosssfilter.js library, this allow us to create dimension and group the data.
var facts = crossfilter(exp);
Now create dimension and then grouped the data. Our both chart are the same, so we use same dimension and group for the chart.
            var dimensionByRun = facts.dimension(function(d){ return [d.Expt, d.Run]; });
            var groupByRun = dimensionByRun.group().reduceSum(function(d){ return d.Speed;})
As we create the objects of our charts now use these objects to develop our chart. Create our first chart. set the with and height and pass the dimension and group that we created above.
seriesChart
                        .width(1350)
                        .height(300)
                        .margins({top:40,bottom:60,right:80,left:60})
                        .dimension(dimensionByRun)
                        .chart(function(chart){ return
                        .group(groupByRun)
We'll use line chart fro our series chart. So create the sub charts in series chart with .chart([]) method
.chart(function(chart){ return dc.lineChart(chart)})
Now write all the other necessary methods require to create our series chart. For more details you can check our Series Chart Tutorials
                        .brushOn(false)
                        .keyAccessor(function(d){ return d.key[1]; })
                        .valueAccessor(function(d){ return d.value; })
                        .seriesAccessor(function(d){ return d.key[0]; })
                        .x(d3.scale.linear().domain([1,25]))
                        .legend(dc.legend().x(100).y(150).itemHeight(10).gap(5).horizontal(3))
                        .xAxisLabel("X Axis")
                        .yAxisLabel("Y Axis")
                        .mouseZoomable(true)
                        .elasticX = function() {
                        return arguments.length ? this : false;
                      };
output:
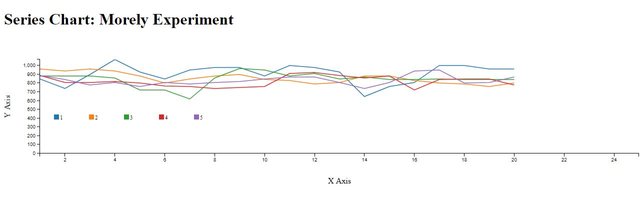
As you know we are creating range series chart, it contains the two charts focus chart and range chart. Our above chart will be our focus chart, and focus chart contains an extra method .rangeChart([]) and takes an argument the object of rangeChart. So, add this method to our above chart.
.rangeChart(seriesChart2) // seriesChart2is our range Chart
Now its time to create our range chart, use the seriesChart2 object to create our range chart. our range chart will be same like our focus chart but we decrease the width and height of the range chart. First, set the width and height of the chart and pass it the dimension and group data.
          seriesChart2
                    .width(700)
                    .height(200)
                    .margins({top:40,bottom:60,right:80,left:60})
                    .dimension(dimensionByRun)
Now create the sub chart usign the .chart([]) method.
                    .chart(function(chart,_,_,i) {
                          var chart = dc.lineChart(chart);

                          return chart;
                          })
Now write all the other necessary methods.
                    .group(groupByRun)
                    .keyAccessor(function(d){ return d.key[1]; })
                    .valueAccessor(function(d){ return d.value; })
                    .seriesAccessor(function(d){ return d.key[0]; })
                    .x(d3.scale.linear().domain([1,25]))
                    .legend(dc.legend().x(100).y(150).itemHeight(10).gap(5).horizontal(3))
                    .xAxisLabel("X Axis")
                    .yAxisLabel("Y Axis");
You can see, its the same like our focus chart except the .chart([]) method. This is because our both chart are the same. If we see the out put
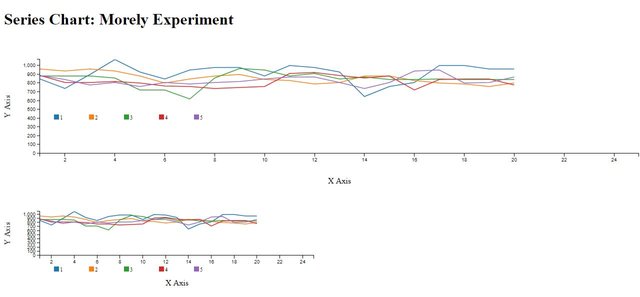
Now its time to filter focus chart when we brush on our range chart. For this take our .chart([]) method of seriesChart2 and replace it with this code.
                    .chart(function(chart,_,_,i) {
                          var chart = dc.lineChart(chart);
                          if(i===0)
                              chart.on('filtered', function (chart) {
                                  if (!chart.filter()) {
                                      dc.events.trigger(function () {
                                          seriesChart2.focusChart().x().domain(seriesChart2.focusChart().xOriginalDomain());
                                          seriesChart2.focusChart().redraw();
                                      });
                                  } else if (!ranges(chart.filter(), seriesChart2.focusChart().filter())) {
                                      dc.events.trigger(function () {
                                          seriesChart2.focusChart().focus(chart.filter());
                                      });
                                  }
                              });
                          return chart;
                          })
Here you can see we use the ranges([])method in the if else() body. We'll develop this method to compare the ranges of focusChart and rangeChart.
            function ranges(r1, r2){
                if (!r1 && !r2) {
                    return true;
                } else if (!r1 || !r2) {
                    return false;
                } else if (r1.length === 0 && r2.length === 0) {
                    return true;
                } else if (r1[0].valueOf() === r2[0].valueOf() &&
                    r1[1].valueOf() === r2[1].valueOf()) {
                    return true;
                }
                return false;
            }
Now our charts are ready to work fine. See the output.
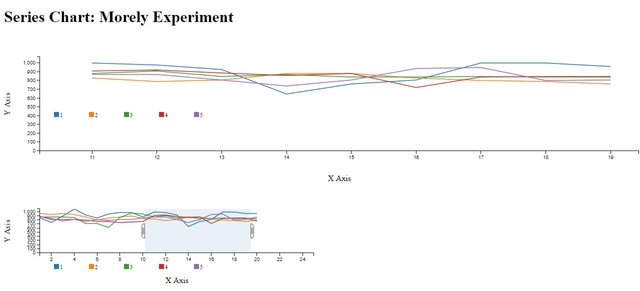
Our chart is working as expected but here is one problem, the series line in the chart are not looks good, they aren't is the smooth.
Here you've to add .interpolate('basis') method to your .chart([]) methos, replace old code with this code in both charts.
dc.lineChart(chart).interpolate('basis').evadeDomainFilter(true);
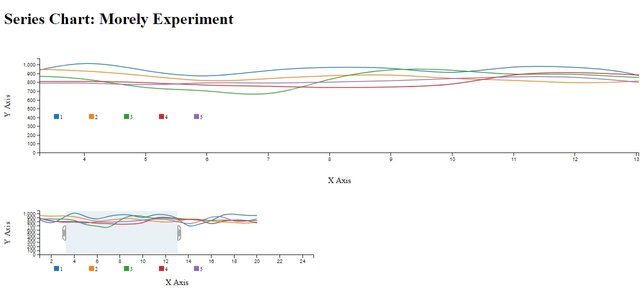
After make changes you can see it looks fine. .interpolate([]) method gets or sets the interpolator to use for lines drawn, this method takes string as an argument, by default it is set to 'linear', there are number of options available that you can use . you can check the list.
Source Code:
<!DOCTYPE html>
<html lang="EN">
    <head>
      <meta charset="utf-8">
      <title>Series Chart</title>
      <script type="text/javascript" src="https://cdnjs.cloudflare.com/ajax/libs/d3/3.5.1/d3.min.js"></script>
      <script type="text/javascript" src="https://cdnjs.cloudflare.com/ajax/libs/crossfilter/1.3.12/crossfilter.min.js"></script>
      <script type="text/javascript" src="https://cdnjs.cloudflare.com/ajax/libs/dc/2.1.9/dc.min.js"></script>
      <link rel="stylesheet" type="text/css" href="https://cdnjs.cloudflare.com/ajax/libs/dc/2.1.9/dc.min.css" />
    </head>
    <body>
        <h1>Series Chart: Morely Experiment</h1>
        <div id="seriesChart"></div>
        <div id="seriesChart2"></div>


        <script language="javascript">

        var seriesChart = dc.seriesChart("#seriesChart");

        var seriesChart2 = dc.seriesChart("#seriesChart2");

            d3.csv("morley.csv", function(error, exp){
                console.log(exp);
            exp.forEach(function(d){
                d.Speed = +d.Speed;
                d.Expt = +d.Expt;
                d.Run = +d.Run;
            });

            var facts = crossfilter(exp);

            var dimensionByRun = facts.dimension(function(d){ return [d.Expt, d.Run]; });
            var groupByRun = dimensionByRun.group().reduceSum(function(d){ return d.Speed;})

            seriesChart
                        .width(1350)
                        .height(300)
                        .margins({top:40,bottom:60,right:80,left:60})
                        .dimension(dimensionByRun)
                        .chart(function(chart){ return dc.lineChart(chart).interpolate('basis').evadeDomainFilter(true); })
                        .group(groupByRun)
                        .brushOn(false)
                        .keyAccessor(function(d){ return d.key[1]; })
                        .valueAccessor(function(d){ return d.value; })
                        .seriesAccessor(function(d){ return d.key[0]; })
                        .x(d3.scale.linear().domain([1,25]))
                        .legend(dc.legend().x(100).y(150).itemHeight(10).gap(5).horizontal(3))
                        .xAxisLabel("X Axis")
                        .yAxisLabel("Y Axis")
                        .rangeChart(seriesChart2)
                        .mouseZoomable(true)
                        .elasticX = function() {
                        return arguments.length ? this : false;
                      };


            seriesChart2
                      .width(700)
                      .height(200)
                      .margins({top:40,bottom:60,right:80,left:60})
                      .dimension(dimensionByRun)
                      .chart(function(chart,_,_,i) {
                            var chart = dc.lineChart(chart).interpolate('basis');
                            if(i===0)
                                chart.on('filtered', function (chart) {
                                    if (!chart.filter()) {
                                        dc.events.trigger(function () {
                                            seriesChart2.focusChart().x().domain(seriesChart2.focusChart().xOriginalDomain());
                                            seriesChart2.focusChart().redraw();
                                        });
                                    } else if (!ranges(chart.filter(), seriesChart2.focusChart().filter())) {
                                        dc.events.trigger(function () {
                                            seriesChart2.focusChart().focus(chart.filter());
                                        });
                                    }
                                });
                            return chart;
                            })
                      .group(groupByRun)
                      .keyAccessor(function(d){ return d.key[1]; })
                      .valueAccessor(function(d){ return d.value; })
                      .seriesAccessor(function(d){ return d.key[0]; })
                      .x(d3.scale.linear().domain([1,25]))
                      .legend(dc.legend().x(100).y(150).itemHeight(10).gap(5).horizontal(3))
                      .xAxisLabel("X Axis")
                      .yAxisLabel("Y Axis");


                dc.renderAll();

            });


            function ranges(r1, r2){
                if (!r1 && !r2) {
                    return true;
                } else if (!r1 || !r2) {
                    return false;
                } else if (r1.length === 0 && r2.length === 0) {
                    return true;
                } else if (r1[0].valueOf() === r2[0].valueOf() &&
                    r1[1].valueOf() === r2[1].valueOf()) {
                    return true;
                }
                return false;
            }


        </script>

    </body>
</html>
Curriculum
Tutorial #16 Dive into DC.JS a JavaScript Library - Link two Charts
Tutorial #15 Dive into DC.JS a JavaScript Library - Range Chart
Tutorial #14 Dive into DC.JS a JavaScript Library - Row Chart
Tutorial #13 Dive into DC.JS a JavaScript Library - Data Table Pagination
Tutorial #12 Dive into DC.JS a JavaScript Library - Heat Map Chart
Tutorial #11 Dive into DC.JS a JavaScript Library - Geo Choropleth Chart
Tutorial #10 Dive into DC.JS a JavaScript Library - Box Plot
Tutorial #9 Dive into DC.JS a JavaScript Library - Series Chart
Tutorial #8 Dive into DC.JS a JavaScript Library - Bubble Chart
Tutorial #7 Dive into DC.JS a JavaScript Library - Data Table
Tutorial #6 Dive into DC.JS a JavaScript Library - Stacked Bar Chart
Tutorial #5 Dive into DC.JS a JavaScript Library - Scatter Plot
Tutorial #4 Dive into DC.JS a JavaScript Library - Composite Chart [Left, Right]
Tutorial #3 Dive into DC.JS a JavaScript Library - Line Chart
Tutorial #2 Dive into DC.JS a JavaScript Library - Pie Chart
Tutorial #1 Dive into DC.JS a JavaScript Library - Bar Chart
Posted on Utopian.io - Rewarding Open Source Contributors
Thank you for the contribution. It has been approved.
You can contact us on Discord.
[utopian-moderator]
Hey @yandot, I just gave you a tip for your hard work on moderation. Upvote this comment to support the utopian moderators and increase your future rewards!
Hey @faad I am @utopian-io. I have just upvoted you!
Achievements
Suggestions
Get Noticed!
Community-Driven Witness!
I am the first and only Steem Community-Driven Witness. Participate on Discord. Lets GROW TOGETHER!
Up-vote this comment to grow my power and help Open Source contributions like this one. Want to chat? Join me on Discord https://discord.gg/Pc8HG9x