Force Layout Diagrams with D3.js
INTRODUCTION
Every data-person will eventually grow and mature beyond Excel (and it's decedents). When it comes to data visualization this happens pretty early and D3 is often the catalyst and inspiration to goto the next level.
It's fair to declare D3.js a mainstream visualization library. With v4 now in production it also qualifies as "mature".
This tutorial will introduce the basic concepts of Network Graphs and will teach and illustrate how to build a dynamic, interactive force layout diagram to visualize a network graph.
CONCEPTS
A Network Graph is a multidimensional dataset that can be represented as a kind of tree diagram. It is also a branch of mathmatics.
A network graph diagram is comprised of leaf nodes and interconnecting branches. Unlike a tree diagram it does not have to have a root note or origin.
The language used to discuss network graphs varies depending on whether you come from a "CompSci" or "MathStats" background.
CompSci people talk in terms of Nodes and Edges. MathStat people talk in terms of Vertices and Links. Data people may talk in terms of Objects and Relationships.
Force Layout Diagram
A Force Layout Diagram takes the network graph diagram and introduces the effects of attraction and repulsion between nodes. The relative strength of these effects can be a variable attribute, causing nodes to cluster or separate.
Both Nodes and their Links can have properties such as color, size and shape which can be dynamic data driven attributes. This can be useful if you want to illustrate multiple facets or dimensions of your data.
For this example, we'll keep things simple and focus only on illustrating the nodes and their connections. For clarity I have separated our network graph data into two separate datasets in two separate files. While this is not a hard requirement it serves to illustrate the differences between the two types of data and their properties.
node.jsoncontains our Nodes/Vertices/Objects.links.jsondescribes the connections between nodes.
This separation also helps if you load data dynamically from a database as each requires different SQL queries to generate them. Trying to concatenate or union the result of two queries into one result set can be challenging.
nodes.json
Each Node in the list has an implicit index number starting at position zero. "London" would occupy the zero position in this example.
You can cut and paste this into a text editor and save it as nodes.json into the working folder on your webserver.
[
    { "name": "London" },
    { "name": "Beijing" },
    { "name": "Paris" },
    { "name": "Athens" },
    { "name": "Rome" },
    { "name": "Amsterdam" },
    { "name": "Wellington" },
    { "name": "Taipei" },
    { "name": "Tokyo" },
    { "name": "Madrid" },
    { "name": "Moscow" },
    { "name": "Oslo" }
]
links.json
This file identifies the start and end points for the connections between the nodes. Nodes are identified by the implied index position so "source":0 is a reference to "London" in nodes.json. Note that some nodes intentionally have no connections but appear to connect to themselves.
You can cut and paste this into a text editor and save as links.json into the working folder on your webserver, alongside your nodes.json file.
[
    { "source": 0, "target": 4 },
    { "source": 1, "target": 4 },
    { "source": 1, "target": 7 },
    { "source": 2, "target": 2 },
    { "source": 3, "target": 1 },
    { "source": 3, "target": 2 } ,
    { "source": 3, "target": 9 },
    { "source": 5, "target": 7 },
    { "source": 4, "target": 4 },
    { "source": 6, "target": 5 },
    { "source": 6, "target": 3 },
    { "source": 8, "target": 9 },
    { "source": 10, "target": 3 },
    { "source": 11, "target": 3 },
    { "source": 11, "target": 11 }
]
index.html
This file contains the combined Javascript and HTML for the bulk of our processing. It can be cut and paste into a text editor and saved into the working folder on your webserver alongside your two data files.
<!DOCTYPE html>
<meta http-equiv="X-UA-Compatible" content="IE=edge" />
<html lang="en">
<html>
  <head>
  <script
      type="text/javascript"
      src="http://d3js.org/d3.v3.min.js">
  </script>
  <script
      type="text/javascript"
      src="http://d3js.org/queue.v1.min.js">
  </script>
</head>
<body>
<script type="text/javascript">
/* Set the diagrams Height & Width */
    var h = 500, w = 950;
/* Set the color scale we want to use */
    var color = d3.scale.category20();
/* Establish/instantiate an SVG container object */
    var svg = d3.select("body")
                    .append("svg")
                    .attr("height",h)
                    .attr("width",w);
/* Build the directional arrows for the links/edges */
        svg.append("svg:defs")
                    .selectAll("marker")
                    .data(["end"])
                    .enter().append("svg:marker")
                    .attr("id", String)
                    .attr("viewBox", "0 -5 10 10")
                    .attr("refX", 15)
                    .attr("refY", -1.5)
                    .attr("markerWidth", 6)
                    .attr("markerHeight", 6)
                    .attr("orient", "auto")
                    .append("svg:path")
                    .attr("d", "M0,-5L10,0L0,5");
/* Pre-Load the json data using the queue library */
queue()
    .defer(d3.json, "nodes.json")
    .defer(d3.json, "links.json")
    .await(makeDiag);
/* Define the main worker or execution function */
function makeDiag(error, nodes, links, table) {
    /* Draw the node labels first */
   var texts = svg.selectAll("text")
                    .data(nodes)
                    .enter()
                    .append("text")
                    .attr("fill", "black")
                    .attr("font-family", "sans-serif")
                    .attr("font-size", "10px")
                    .text(function(d) { return d.name; });
    /* Establish the dynamic force behavor of the nodes */
    var force = d3.layout.force()
                    .nodes(nodes)
                    .links(links)
                    .size([w,h])
                    .linkDistance([250])
                    .charge([-1500])
                    .gravity(0.3)
                    .start();
    /* Draw the edges/links between the nodes */
    var edges = svg.selectAll("line")
                    .data(links)
                    .enter()
                    .append("line")
                    .style("stroke", "#ccc")
                    .style("stroke-width", 1)
                    .attr("marker-end", "url(#end)");
    /* Draw the nodes themselves */
    var nodes = svg.selectAll("circle")
                    .data(nodes)
                    .enter()
                    .append("circle")
                    .attr("r", 20)
                    .attr("opacity", 0.5)
                    .style("fill", function(d,i) { return color(i); })
                    .call(force.drag);
    /* Run the Force effect */
    force.on("tick", function() {
               edges.attr("x1", function(d) { return d.source.x; })
                    .attr("y1", function(d) { return d.source.y; })
                    .attr("x2", function(d) { return d.target.x; })
                    .attr("y2", function(d) { return d.target.y; });
               nodes.attr("cx", function(d) { return d.x; })
                    .attr("cy", function(d) { return d.y; })
               texts.attr("transform", function(d) {
                        return "translate(" + d.x + "," + d.y + ")";
                        });
               }); // End tick func
}; // End makeDiag worker func
</script>
</body>
</html>
We've chosen to load the two data files with the queue library (lines 42-45). This approach avoids async page vs data loading issues (lots of questions at StackOverflow on this).
The .style attributes can be moved into a css file but for newcomers, I've chosen to leave it here to make tweaking simpler. So now you should have three files in the folder on your webserver.
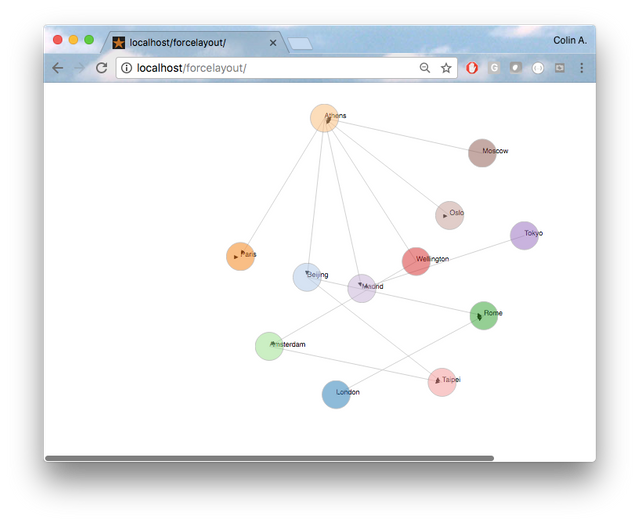
You can now point your web browser at the folder on your webserver and behold your force layout diagram.
Posted on Utopian.io - Rewarding Open Source Contributors
Thank you for the contribution. It has been approved.
You can contact us on Discord.
[utopian-moderator]
Hey @flauwy, I just gave you a tip for your hard work on moderation. Upvote this comment to support the utopian moderators and increase your future rewards!
Hey @morningtundra I am @utopian-io. I have just upvoted you!
Achievements
Suggestions
Get Noticed!
Community-Driven Witness!
I am the first and only Steem Community-Driven Witness. Participate on Discord. Lets GROW TOGETHER!
Up-vote this comment to grow my power and help Open Source contributions like this one. Want to chat? Join me on Discord https://discord.gg/Pc8HG9x