Interactive Heat Maps with D3js and Cal-Heatmap
What Will I Learn?
Multivariate time series heat maps are a great way to illustrate data over time. Cal-Heatmaps is a helper-library for D3js that makes beautiful heatmaps simple.
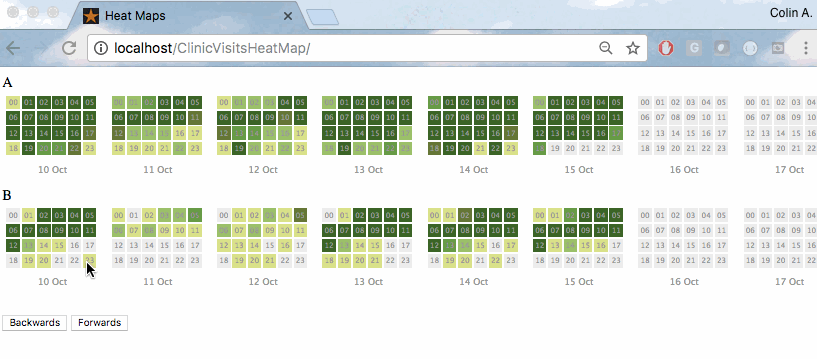
In this tutorial we will illustrate two datasets in a scrolling calendar. The trailing seven days will be illustrated by day and summarized by hour. Each cell will represent an hour and the roll-over tool top will summarize the activity for the hour.
The data source is a series if flat CSV files exported from a database but could just as well be a SQL query to a live database. This is an example TSQL query that you might use to get transaction data from a MS SQL Server into a suitable form we can use in our example,
SET TRANSACTION ISOLATION LEVEL READ UNCOMMITTED;
USE [myTransactiondb];
GO
DECLARE @_START DATE; SET @_START = GETDATE()-14;
DECLARE @_END DATE; SET @_END= GETDATE();
SELECT
     /* CONVERT datetime to UNIX_TIMESTAMP*/
     DATEDIFF(SECOND, {d '1970-01-01'}, [datetime]) AS  [datetime]
     ,COUNT([transactionID]) AS [value]
    From[myTrnsactionTable]
    WHERE [datetime] BETWEEN @_START AND @_END
    GROUP BY DATEPART(hour, [datetime]), [datetime]
    ORDER BY [datetime] DESC
Requirements
Your web browser will need Javascript enabled and you will want to be able to serve these files to the browser via webserver such as IIS or Apache.
Difficulty
- Basic
The data
Our data will be stored in two separate flat files (comma delimited CSVs),
1. A_data.csv
2. B_data.csv
Each file contains only two columns with a header row. We'll illustrate 9 rows of example data which can be cut and paste into text files with a .csv extension. This should be just enough to get your example working.
The code is setup to allow you to include any number of datasets beyond the two we use in our example.
A_data.csv
datetime,value
1413416220,1
1413413100,1
1413405720,1
1413405600,2
1413405540,1
1413405480,4
1413404880,1
1413403560,1
1413402120,1
B_data.csv
datetime,value
1413417240,1
1413417180,2
1413416700,1
1413416640,1
1413416580,4
1413416520,2
1413416340,1
1413416100,1
1413415980,1
The Code
All the heavy lifting takes place in the index.html file. The example below has inline comments line by line.
This can be cut and paste into index.html and place in a folder on your webserver along side your A_data.csv and B_data.csv files.
<head>
    <meta charset="utf-8">
    <meta http-equiv="X-UA-Compatible" content="IE=edge">
    <title>Heat Maps</title>
    <meta name="viewport" content="width=device-width, initial-scale=1">
    <script type="text/javascript" src="//d3js.org/d3.v3.min.js"></script>
    <script type="text/javascript" src="//cdn.jsdelivr.net/cal-heatmap/3.3.10/cal-heatmap.min.js"></script>
    <link rel="stylesheet" href="//cdn.jsdelivr.net/cal-heatmap/3.3.10/cal-heatmap.css" />
</head>
<body>
<div id="A">A</div>
<div id="B">B</div>
<p>
<button id="domain-highlight-previous-selector" style="margin-bottom: 10px;">Backwards</button>
<button id="domain-highlight-next-selector" style="margin-bottom: 10px;">Forwards</button>
<script type="text/javascript">
    // Simple function to convert parsed tabular csv data to
    // something resembling a Javascript object.
    function converter(data) {
        var i, total, results = {};
        for (i=0, total = data.length; i<total; i++) {
            results[+data[i].datetime] = +data[i].value ;
        }
        return results;
    }
// Instantiate a new Date object
var start_date = new Date();
    // Set the date to 7 days ago
    start_date.setDate(start_date.getDate() -7 );
// Define 4 identifiers for the sets of data.
// Note divs above with matching ids.
var datasets = ["A", "B"];
// Iterate through the 4 datasets passing each
// as a parameter into the function.
datasets.forEach(function(myObject) {
        //Instantiate a calendar (SVG) object
        var cal = new CalHeatMap();
        // Initialize the object with rendering parameters
        cal.init({
                // Use the hospital mnemonic as a dic selector
                itemSelector: "#"+myObject,
                // Assign each one a unique namespace
                itemNamespace: myObject,
                // Use mnemonic to identify the corresponding csv file
                data: myObject+"_data.csv",
                // Use the cal-heatmap csv data parser
                dataType: "csv",
                // After parsing the csv, run reults through the converter function
                afterLoadData: converter,
                // Set number of Day domains/blocks
                range: 8,
                // Set each domain to be 1 day
                domain: "day",
                // Illustrate hours left to right (as opposed to top to bottom)
                subDomain: "x_hour",
                // Label each cell with Hour in 24 hr notation
                subDomainTextFormat: "%H",
                // Set the initial start date to render
                //start: start_date,
                start: new Date(2014, 9, 10),
                // Set size of each hour
                cellSize: 15,
                // Set spacing between domains
                domainGutter: 5,
                domainMargin: 5,
                // Set animation speed
                animationDuration: 1500,
                // What to call when selector buttons are clicked
                nextSelector: "#domain-highlight-next-selector",
                previousSelector: "#domain-highlight-previous-selector",
                // Draw fancy roll over tool tips
                tooltip: true,
                // Set the data class labels for roll over tool tips
                itemName: ["visit", "visits"],
                // Draw a legend under each panel
                displayLegend: false
                });
        });
</script>
</body>
</html>
Posted on Utopian.io - Rewarding Open Source Contributors
Thank you for the contribution. It has been approved.
You can contact us on Discord.
[utopian-moderator]
Upvote for upvote
https://steemit.com/introductionyourself/@sawmpil/introduction-5446de6843966
I'm always on the lookout for anything that makes data look amazing!
Hey @morningtundra I am @utopian-io. I have just upvoted you!
Achievements
Suggestions
Get Noticed!
Community-Driven Witness!
I am the first and only Steem Community-Driven Witness. Participate on Discord. Lets GROW TOGETHER!
Up-vote this comment to grow my power and help Open Source contributions like this one. Want to chat? Join me on Discord https://discord.gg/Pc8HG9x
Wow. Great
မိုက္တယ္
Congratulations! This post has been upvoted from the communal account, @minnowsupport, by morningtundra from the Minnow Support Project. It's a witness project run by aggroed, ausbitbank, teamsteem, theprophet0, someguy123, neoxian, followbtcnews, and netuoso. The goal is to help Steemit grow by supporting Minnows. Please find us at the Peace, Abundance, and Liberty Network (PALnet) Discord Channel. It's a completely public and open space to all members of the Steemit community who voluntarily choose to be there.
If you would like to delegate to the Minnow Support Project you can do so by clicking on the following links: 50SP, 100SP, 250SP, 500SP, 1000SP, 5000SP.
Be sure to leave at least 50SP undelegated on your account.