Steemit Time Series Analysis Q4 2017
INTRODUCTION
This is a time series analysis of the Steem ecosystem for Quarter 4 of 2017. Specifically this examines Steem block chain Posts and includes transactions committed from entry points such as Steemit, Utopian, Busy, Steepshot etc.
The Steemit social platform was launched on July 4th of 2016 as the first of these entry points; limiting the dataset to approximately 18 months or six quarters.
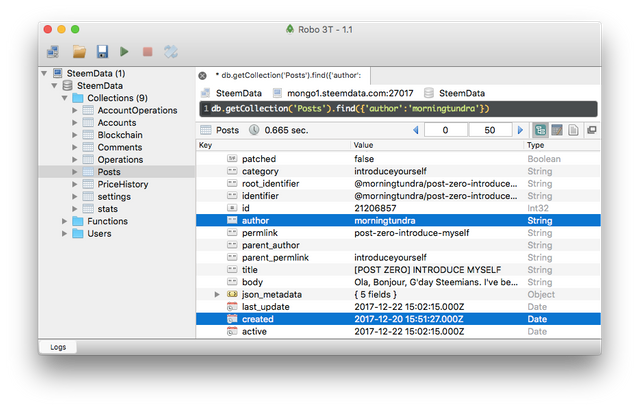
The data source for this analysis is Steemdata.com via the MongoDB API. For this analysis we're examining the Posts Collection and two specific objects, author and created (illustrated in the screenshot below).
Q2 2017
During the 92 days of Q4 there were 4,827,069 posts submitted by 100,198 unique accounts for an average of ~20 posts per account. This cohort of users exhibit widely disperate usage patterns ranging from a single posts to ~20,000 posts.
Q4 Summary
| Min. | 1st Qu. | Median | Mean | 3rd Qu. | Max. |
|---|---|---|---|---|---|
| 1.0 | 1.0 | 4.0 | 19.98 | 12.0 | 18607.0 |
Q3 Summary:
| Min. | 1st Qu. | Median | Mean | 3rd Qu. | Max. |
|---|---|---|---|---|---|
| 1.0 | 1.0 | 3.0 | 17.1 | 12.0 | 8842.0 |
Q2 Summary
| Min. | 1st Qu. | Median | Mean | 3rd Qu. | Max. |
|---|---|---|---|---|---|
| 1.0 | 1.0 | 4.0 | 13.81 | 11.0 | 2700.0 |
Q1 Summary:
| Min. | 1st Qu. | Median | Mean | 3rd Qu. | Max. |
|---|---|---|---|---|---|
| 1.0 | 1.0 | 3.0 | 14.5 | 12.0 | 1351.0 |
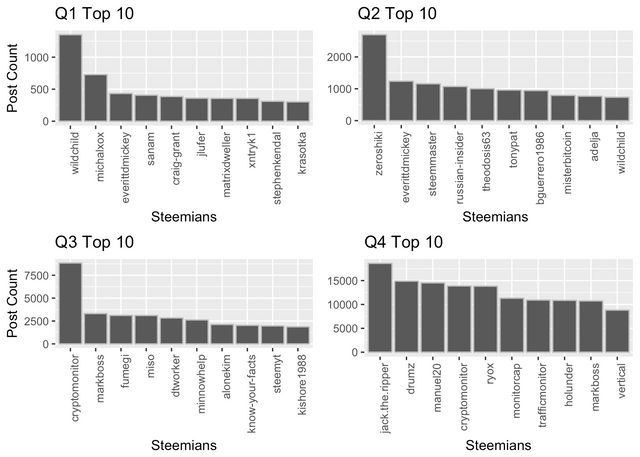
Q4 Top 10 Most Prolific Users
A cursory look at the top 10 most prolific users in Q4 indicate the growing presence of automated bots. This top 10 have an average daily post count of 134.
| Steemian | Post Count | |
|---|---|---|
| 1 | @jack.the.ripper | 18607 |
| 2 | @drumz | 14887 |
| 3 | @manuel20 | 14524 |
| 4 | @cryptomonitor | 13878 |
| 5 | @ryox | 13829 |
| 6 | @monitorcap | 11310 |
| 7 | @trafficmonitor | 10923 |
| 8 | @holunder | 10857 |
| 9 | @markboss | 10738 |
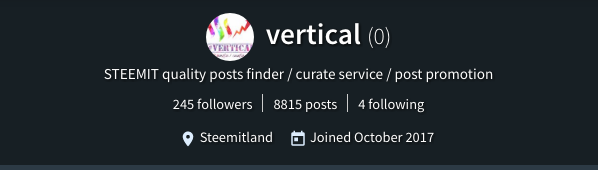
| 10 | @vertical | 8813 |
Comparing this Q4 list of elite user accounts to previous three quarters, we see significant growth in Post volume. Top performers from previous quarters appear to be getting crowded out by a new breed of very high frequency robot accounts.
Robots are clearly present in prior quarters but exhibit more modest posting rates.
Top poster in Q1 (@wildchild) appears to be a robot and posts only Press Releases. Top poster in Q2 (@zeroshiki) appears to be a real human with a large following and high reputation posting on a variety of crypto-related topics. Top poster in Q3 (@cryptomonitor) appears to be a human. This individual appears to have dropped out of the Q4 rankings due to aggressive robotic down voting in December.
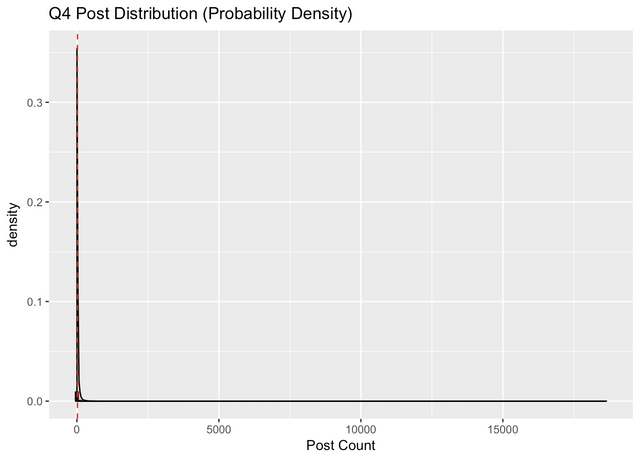
These relatively few but highly prodigious robot accounts have confounding effects when examining the activity of human users. The affect is illustrated by the plot below. The excessively long-tail makes the average or typical activity almost indistinguishable. The mean being indicated by the red dotted line.
The plot does however serve to emphasise the scale to which bot activity is crowding out human contributers.
Q4 Human User Activity
We can attempt to filter out the noisy robot outliers and amplify the lower portion of the chart with a logarithmic scale and again compare to previous 2017 quarters. This would seem to be a much fairer reflection of human users.
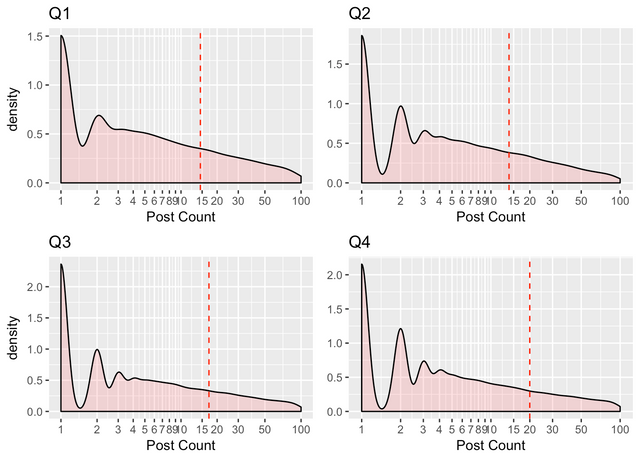
We observe in these four Probability Densitiy Distribution charts above, growth in the mean number of posts by ~5% over the year. From the summaries above this is likely a consequence of robot activity influencing the overall population mean.
We also observe marginal growth in the number of accounts posting twice per quarter. The declining tail of the chart highlights the relatively few humans able to sustain high frequency posting.
Weekly & Daily Activity
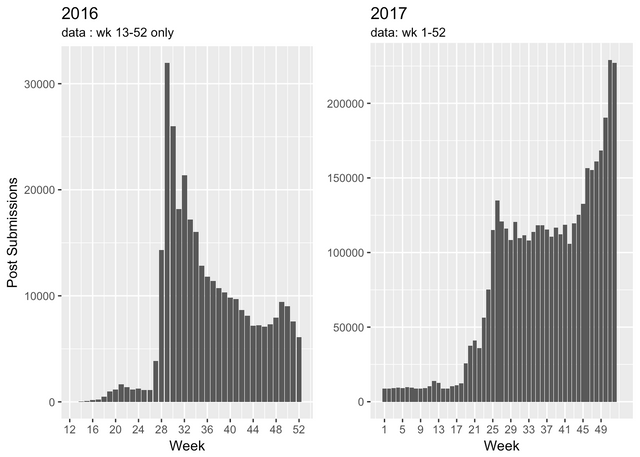
We can also consider Posting patterns by Week of the Year and from the two charts below we observe sustained year on year growth in Post volume (note Y-axis scales).
With the relatively limited historical data (~18 months) no obvious seasonable affects can be adjusted for and these charts serve to illustrate only the sustained growth over the period.
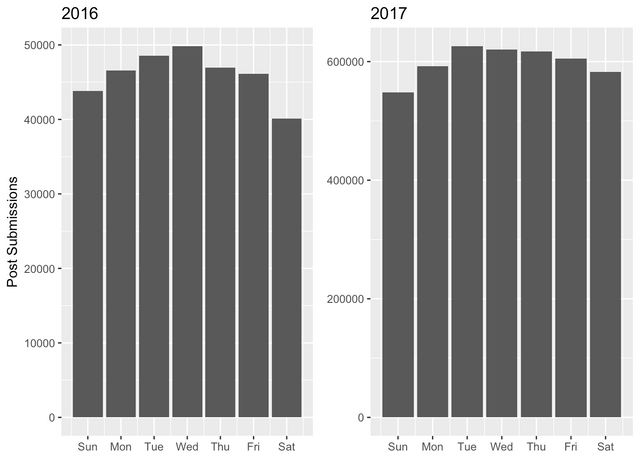
Posting activity by day of week.
Posting patterns by day of the week indicate mid week remains the most popular time to Post.
However, the relatively lower weekend traffic may be a consequence of of robot-maintenance being performed over the weekends; suspending their high frequency posting.
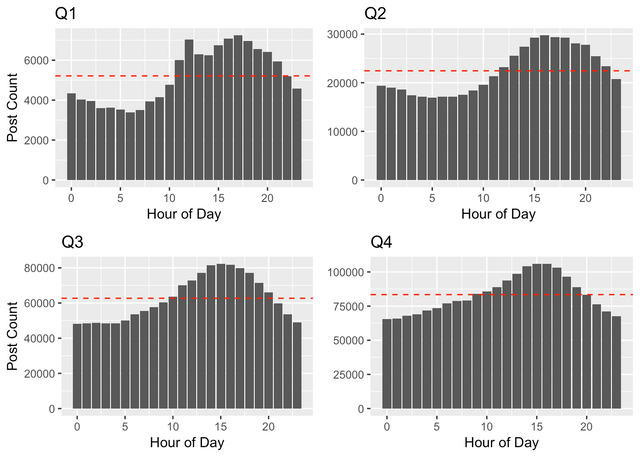
2017 Posting activity by hour of day.
These four charts indicate post volume by hour of day, unadjusted for time zones.
We observe to two important phenomena. The daily average (red dotted line) continues to rise and the early morning dip around 05:00am begins to flatten out. The trend being towards a flattening of the curve. This high frequency, around the clock posting pattern is again indicative of rising levels of robotic automation. Robots don't sleep.
CONCLUSION - "The Robots are Coming".
Growth in user account and Post volume continue to accelerate. The two cannot be correlated due confounding mentioned above. Separating humans and robot accounts into separate chorts will be necessary to better understand how these two types of user are developing.
The long tail of the density distribution charts and the very high average daily posts in Q4 indicate automated robot accounts continue to proliferate. We can expect to see this cohort gainning increasing visibility and influence.
Users with high levels of technical automation skills will dominate the Hot, Trending and Promoted sections in an increasingly aggressive battle for Upvotes. This arms race shows no signs of peaking. Finding high quality human generated content will continue to be challenging.
If this trend continues we can expect to see Steem becoming a social platform for robots, with human users participating on the fringes; most likely in highly niche categories. Earnings will be dominated by those with the most robotic fire power (highly technically proficient users).
As automation becomes more prevalent and competition increases, we can expect to see more widespread use of automated down voting of competing robots. This tactic is likely to be employed in a manner simmilar to "hedging" a complex derivatives trade.
There appear to be many parallels between the growth of Steem and the early days of the electronic financial markets in the 1990s.
This post is written in R-Markdown and the R language so if you're inclined, review the code at the [github repository](https://github.com/nyquist212/morning10). If you find errors or corrections, feel free to leave me a comment of submit a pull request.
Posted on Utopian.io - Rewarding Open Source Contributors
Has anyone made a bot to find out how many bot accounts there are?
Not that I know of but I think I could work out an algorithm or a Basian model to identify a bot with high degree of statistical certainty.
Interesting, it could give us some insight on how many bots there and how active they're.
good question must be answer
Thank you for the contribution. It has been approved.
You can contact us on Discord.
[utopian-moderator]
best analysis
great post
superb analysis i must say.
"Dhan'yavāda"
Swaagatam
I read your analysis with great interest. Thanks for the effort.
I'm definitely interested in trying to identify and perhaps isolate this phenomenon of automation in posts and comments.
Thank you.
That visualization in your last post is beautiful. Did you create that?
great analysis
@originalwork
@originalworks
A fine piece of analysis this!
@miniature-tiger may have some info/analysis on bot accounts. I think they can be tracked.....
How do we create new value? You create value by running services on the blockchain.
Dtube Success story! Must watch and ReSteem