Best Time to Post on Steemit [Analysis between 2017 - 2018 (Feb1)]

Summary / Details
I would like to collect information and share with you my analysis about best and worst time to post on Steemit. So my main question is "When to post to earn more?" Like every website Steemit has various number of visitors from different countries at different times during a day. I got data between 02-01-2017 - 02-01-2018. I worked with payout values and number of up-votes to answer my question.
Outline
The analysis will cover these points in this analysis.
- 1.1 Total Number of Posts for each Hour
- 1.2 Total Payout Value of Posts for each Hour
- 1.3 Average Payout Value of Posts for each Hour
- 1.4 Total Number of Up-votes for each Hour
- 1.5 Average Number of Up-votes for each Hour
- 2.1 Average Value of Total Number of Posts for each Day
- 2.2 Total Payout Value of Posts for each Day
- 2.3 Average Payout Value of Posts for each Day
- 2.4 Total Number of Up-votes for each Day
- 2.5 Average Number of Up-votes for each Day
Tools & Work Details
Scope of Analysis
Timeframe of my data is the interval Feb 1 2017 - Feb 1 2018. I choose this interval to get more detailed data and analyse it for different aspects which I stated in Outline section above.
.
Tools
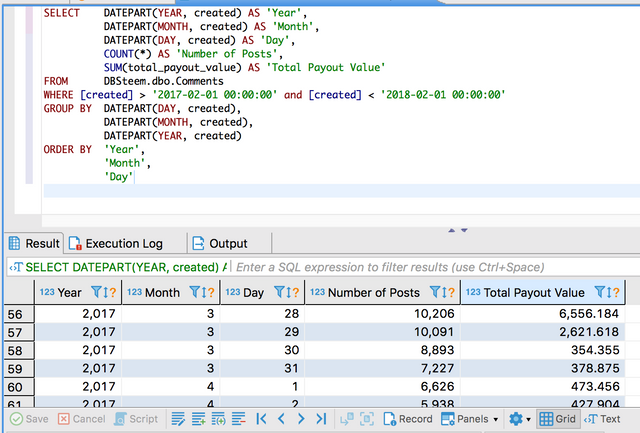
I used DBeaver which is an universal SQL client. It is free multi-platform database tool for developers, SQL programmers, database administrators and analysts. I connected to SteemSQL which is a publicly available Microsoft SQL database containing all the Steem blockchain data.
I used the code below and change it a little bit for upvotes - earnings and days - hours.
SELECT    DATEPART(YEAR, created) AS 'Year',
          DATEPART(MONTH, created) AS 'Month',
          DATEPART(DAY, created) AS 'Day',
          COUNT(*) AS 'Number of Posts',
          SUM(net_votes) AS 'Total Number of Upvotes'
FROM      DBSteem.dbo.Comments
WHERE [created] > '2017-02-01 00:00:00' and [created] < '2018-02-01 00:00:00'
GROUP BY  DATEPART(DAY, created),
          DATEPART(MONTH, created),
          DATEPART(YEAR, created)
ORDER BY  'Year',
          'Month',
          'Day'
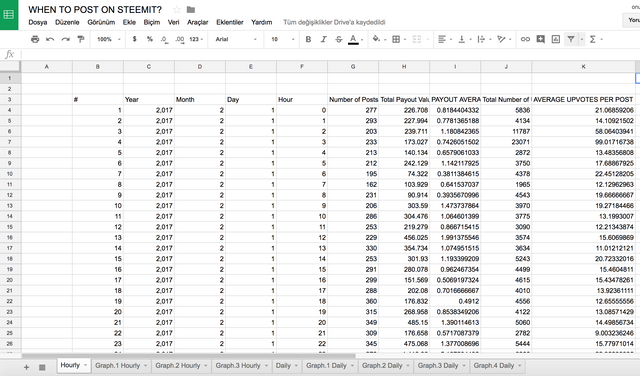
After I fetch tables using the code. I created a Google Drive document (spreadsheets) and copy all data to the document to create tables on it and to share all my work with you using Google Drive links you can find in results section.
Results
In each result under Hour section 0 states for GMT 00:00-01:00, 1 states for GMT 01:00-02:00, 2 states for 02:00-03:00 and goes on.
All data and graphs can be found here.
1.1 Total Number of Posts for each Hour
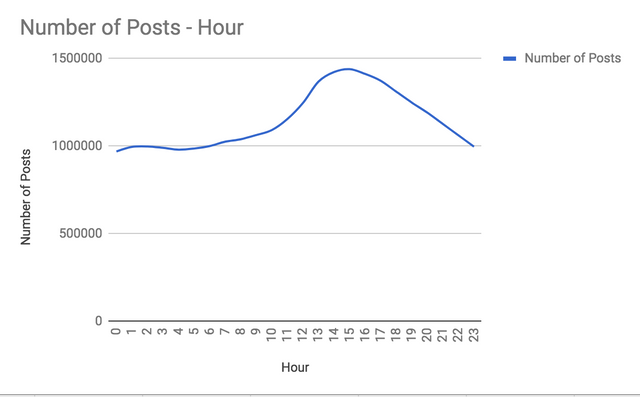
How to read it?
The graph has information of hours in X Axis and total number of posts during 365 days grouped by each hour in Y Axis. For example we see a point on the line which has 0 in the X Axis and 970234 in the Y Axis. This means that during 00:00-01:00 (in GMT) 970234 posts are created during the time interval I analyse.
As you can see from the graph between 00:00-08:00 (in GMT) total number is almost 1 million for each hour. The number of posts increases as going until 15:00-16:00 (in GMT) which is actually the maximum extreme-point of the graph.
- Total number of 1440039 posts created during 15:00-16:00 (in GMT) which is the highest number in this category.
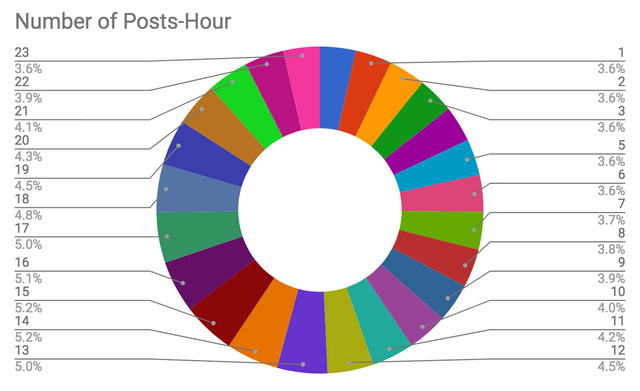
- 25.5% of all posts are created between 13:00-18:00(in GMT)
13:00 in GMT is 08:00 in EST which can be also thought as morning in US. So people in US are awaken right now and they started using Steemit. If you check Suns position using this link the time interval of 13:00-18:00 (in GMT) is actually the time line where the people in most of Asia, people in Europe and people in most of America (3 continents which have most visitors) are awaken (not sleeping). The main reason of the high number of creation of posts.
1.2 Total Payout Value of Posts for each Hour
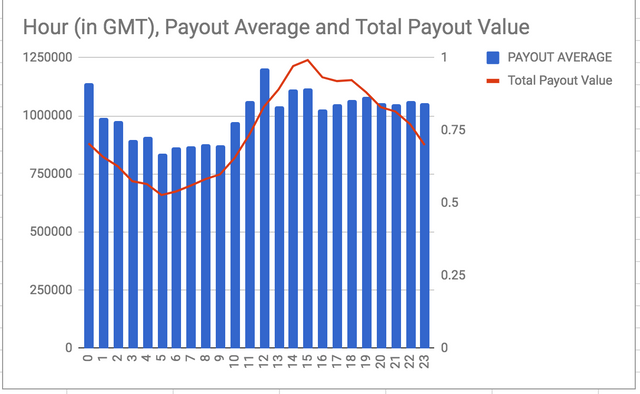
How to read it?
The graph has information of hours in X Axis. In left-hand side of Y Axis there are values of total payout values during 365 days grouped by each hour. In the right-hand side of Y Axis there are values of average payout values. For example we see a point on the line which has 0 in the X Axis and 881672 and 0.91217 in the Y Axis. This means that posts created during 00:00-01:00 (in GMT) has total payouts of 881672. Also average for each post is 0.91217.
- Highest value of total payout of posts is 1240380 which is for posts created during 15:00-16:00 (in GMT).
- Lowest value of total payout of posts is 659410 which is for posts created during 05:00-06:00 (in GMT).
Total payout for posts is strongly correlated with number of posts as you can also figured out comparing first three graphs I mentioned above. So to answer the question for Best time to post on steemit we should work for Average payout values.
1.3 Average Payout Value of Posts for each Hour
- Highest value of average payout of posts is 0.965 which is for posts created during 12:00-13:00 (in GMT).
- Lowest value of average payout of posts is 0.6683 which is for posts created during 05:00-06:00 (in GMT).
As you can see from graphs there is also correlation between average payout of posts and number of posts. However the correlation is not as strong as the total payouts. I mentioned that the reason of having high number of posts during some time intervals is related with number of people who visit Steemit. Also if you create some posts during that time interval it is logical that more people will see it because there are more people in Steemit (your posts are seen in the new section at least, maybe in trending section, both are related with time) The high number at the time interval 00:00-01:00 might be reasoned by people in US and KR have more Steem power, they might use that power in that time line which is the most active intersection of those two countries.
1.4 Total Number of Up-votes for each Hour
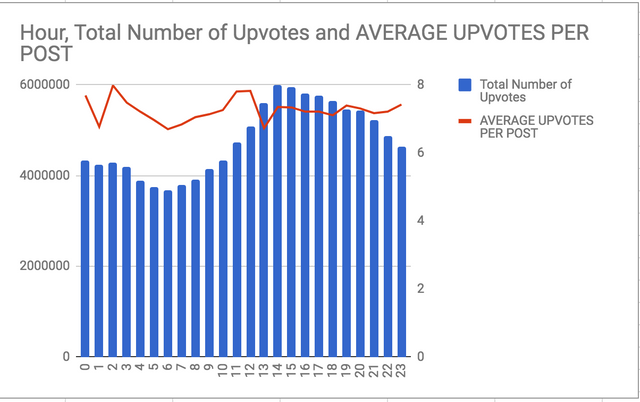
How to read it?
The graph has information of hours in X Axis. In left-hand side of Y Axis there are values of total number of up-votes during 365 days grouped by each hour. In the right-hand side of Y Axis there are values of average number of up-votes. For example we see a point on the line which has 0 in the X Axis and 4329994 and 7.6900 in the Y Axis. This means that posts created during 00:00-01:00 (in GMT) has total upvotes of 4329994. Also average for each post is 7.6900.
- Highest value of total number of up-votes of posts is 5990389 which is for posts created during 14:00-15:00 (in GMT).
- Lowest value of total number of up-votes of posts is 3682275 which is for posts created during 06:00-07:00 (in GMT).
1.5 Average Number of Up-votes for each Hour
- Highest value of average number of up-votes of posts is 7.9839 which is for posts created during 14:00-15:00 (in GMT).
- Lowest value of average number of up-votes of posts is 6.6985 which is for posts created during 06:00-07:00 (in GMT).
Total number of up-votes is strongly correlated with total number of posts. On the other hand average number of up-votes is not. The difference might be reasoned by bots which send many up-votes during different time lines. The main stats for hourly comparison should be the average-payout value not total number of up-votes. For most people in Steemit (also for Steemit community, algorithm) the number of up-votes is not as important as total payout. I think like that because for trending topics the most important think is the value of up-votes, not the number of up-votes.
2.1 Average Value of Total Number of Posts for each Day
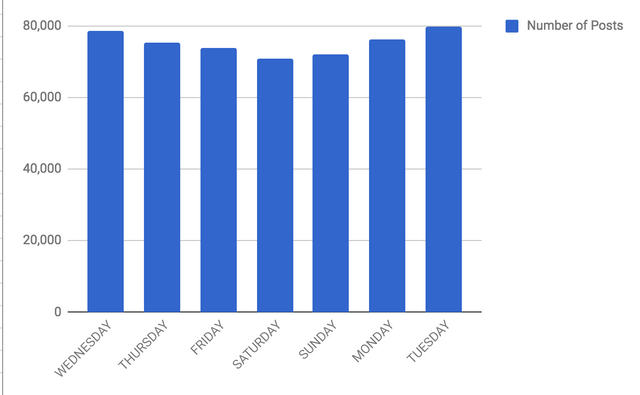
How to read it?
The graph has information of days in X Axis and average of total number of posts during 365 days grouped by each day in Y Axis. For example we see a point on the line which has Wednesday in the X Axis and 78762 in the Y Axis. This means average of 78762 posts are created for each wednesday during the time interval I analyse.
- Highest value of average of total number of posts is 79937 which is for posts created on Tuesday.
- Lowest value of average of total number of posts is 70972 which is for posts created on Saturday.
There are not so much difference between days. However creation of topics on Saturday and Sunday are significantly less than other days. This should be caused by holidays on those days in many countries.
2.2 Total Payout Value of Posts for each Day
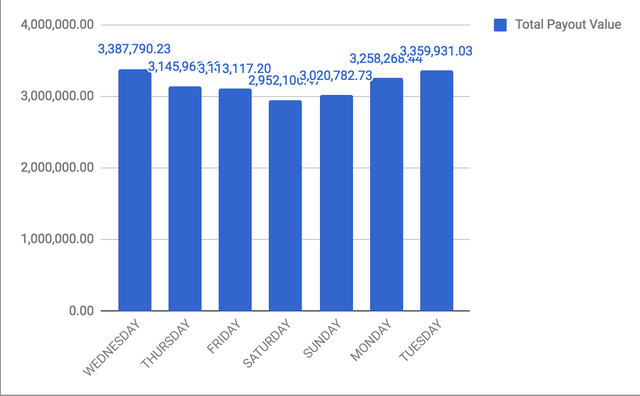
How to read it?
The graph has information of days in X Axis and total payout value of posts during 365 days grouped by each day in Y Axis. For example we see a point on the line which has Wednesday in the X Axis and 3387790 in the Y Axis. This means 3387790 is total payout for posts are created for wednesday during the time interval I analyse.
- Highest value of total payout of posts is 3387790 which is for posts created on Wednesday.
- Lowest value of total payout 2952106 of posts is 70972 which is for posts created on Saturday.
2.3 Average Payout Value of Posts for each Day
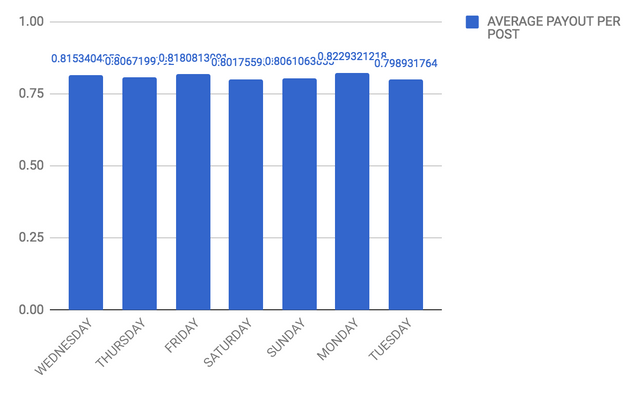
How to read it?
The graph has information of days in X Axis and average of total payout for posts during 365 days grouped by each day in Y Axis. For example we see a point on the line which has Wednesday in the X Axis and 0.815340 in the Y Axis. This means 0.815340 is average of payout per posts are created on Wednesday during the time interval I analyse.
- Highest value of average payout of posts is 0.8229 which is for posts created on Monday.
- Lowest value of average payout of posts is 0.7989 which is for posts created on Tuesday.
There is a correlation between total payout of posts and the number of posts. However as we investigate the average payout of posts Monday has the highest value. It might be reasoned by monday's situation. Monday is after saturday and sunday, which are less visited days, less posts are created and less up-votes are given during those days. So there might be more voting power left for Monday. (Also psychological reasons might be there) On monday people are more generous, the average payout value for monday created topics are bigger. And maybe after this generosity tuesday might be less creative. But it is certain that there is different between those days. So monday should be preferred.
2.4 Total Number of Up-votes for each Day
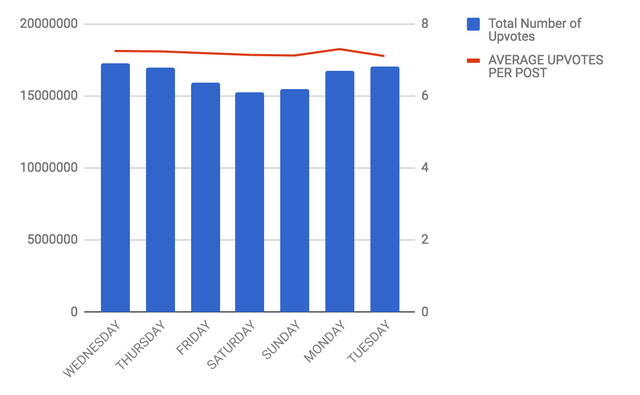
How to read it?
The graph has information of days in X Axis. In left-hand side of Y Axis there are values of total number of up-votes during 365 days grouped by each day. In the right-hand side of Y Axis there are values of average number of up-votes. For example we see a point on the line which has Wednesday in the X Axis and 17309033 and 7.25 in the Y Axis. This means that posts created during 00:00-01:00 (in GMT) has total upvotes of 17309033. Also average for each post is 7.25.
- Highest value of total number of up-votes of posts is 17309033 which is for posts created on Wednesday.
- Lowest value of total number of up-votes is 15255098 which is for posts created on Saturday.
2.5 Average Number of Up-votes for each Day
- Highest value of average number of up-votes of posts is 7.3066 which is for posts created on Monday.
- Lowest value of average number of up-votes is 7.1151 which is for posts created on Tuesday.
Total number of up-votes has strong correlation with total number of posts. Also as you can see from the graph average numbers of up-votes for each day are between 7.1151 (Monday) and 7.3066 (Tuesday) which also follows and supports the average payout values for each day.
Logical Conclusions from Results
Day with least and most number of posts
Day with least number of posts is Saturday and day with most number of posts is Tuesday. Saturday and Sunday are weekend and holiday in many countries this is why number of posts are less than other days.
Lucky Day for Earnings and Upvotes = Monday
Monday has an average of 0.8229 payout. Which is significantly bigger than other days, especially from Tuesday with 0.7989. So lucky day for earnings is Monday and unlucky day is Tuesday. Also for up-votes the owner of highest average is still the same: Monday.
Time Interval with least up-votes, least average up-votes, least payouts and least average payouts
Unluckiest time interval with the properties I mentioned in the title is 1:00-9:00 (GMT).
Final Summary
So the luckiest time might be considered as posting on Monday and posting at 12:00-13:00 (GMT). However as considering average up-votes, earnings and created post numbers the most accurate conclusion is posting between 1:00-9:00 (GMT) is not logical if you want to reach more people and earn more.
Posted on Utopian.io - Rewarding Open Source Contributors
ONUR KAHVECİ ÇOK TEMİZ ÇALIŞMA OLMUŞ EMEĞİNE SAĞLIK.
Teşekkürler yorumunuz için.
Thank you for the contribution. It has been approved.
You can contact us on Discord.
[utopian-moderator]
Thank you for your help, decision and guidance!
Analiz güzel, ellerine sağlık.
Teşekkürler!
@onurkahveci, Upvote is the only thing I can support you.
Thanks for your support.
@onurkahveci tebrikler cok guzel analiz olmus umarim genis bir kitleye ulasir ve herkes icin yararli olur calismalarinin devamini sabirsizlikla bekliyorum ...
Teşekkürler kardeşim.
Hey @onurkahveci I am @utopian-io. I have just upvoted you!
Achievements
Community-Driven Witness!
I am the first and only Steem Community-Driven Witness. Participate on Discord. Lets GROW TOGETHER!
Up-vote this comment to grow my power and help Open Source contributions like this one. Want to chat? Join me on Discord https://discord.gg/Pc8HG9x
Thank you for this, was exactly what I was looking for! It's really informative and helpful, hope you do more of these :)