TUTORIAL || How To MAKE GRAPHS WITH PHP MYSQL AND WITH CHARTJS METHOD
What Will I Learn?
- We will learn how to create Graphics
- We will learn how to wrap data in a graph
- We will learn the system work from the graph
Requirements
- Xampp app
- Text editor
- Browser apps (chrome, Mozilla ferofex, opera, and more)
Difficulty
- Intermediate
Tutorial Contents
Description
Graphics are tools that can be used to communicate information graphically. Includes graphics in documents that can help you describe numerical data, such as comparisons and trends, making it easier for readers to understand it.
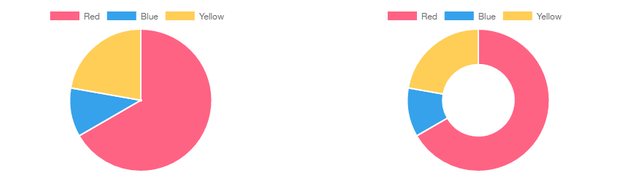
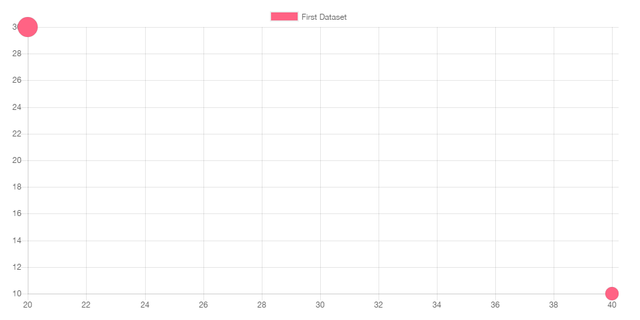
ChartJS is one of the libraries that utilize the canvas elements to create graphs that will be displayed through a web browser, we can use the ChartJS library to display report information in graphical form so that it is more easily understood by others than to display data in tabular form. ChartJS itself supports 6 chart types as follows:
- Tipe 1 line chart
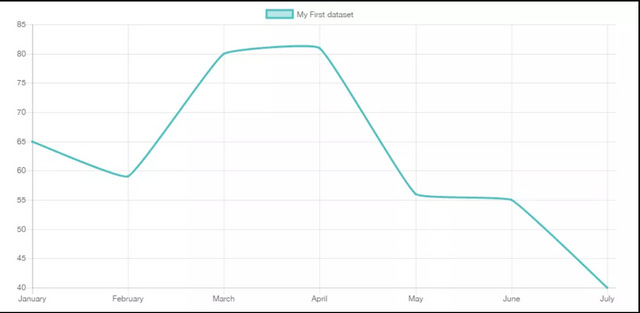
- Tipe 2 – bar chart
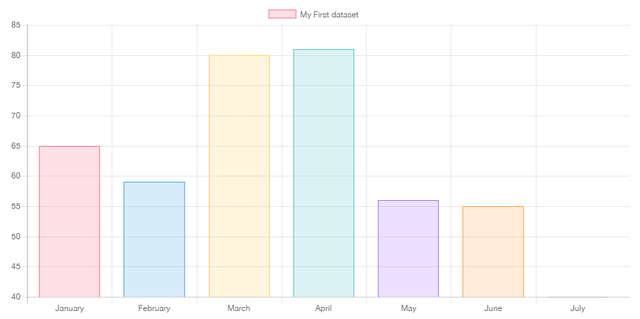
- Tipe 3 radar chart
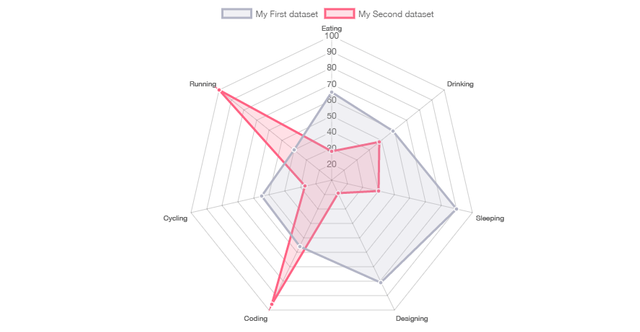
- Tipe 4 pola area chart
- Tipe 5 pie dan dognot chart
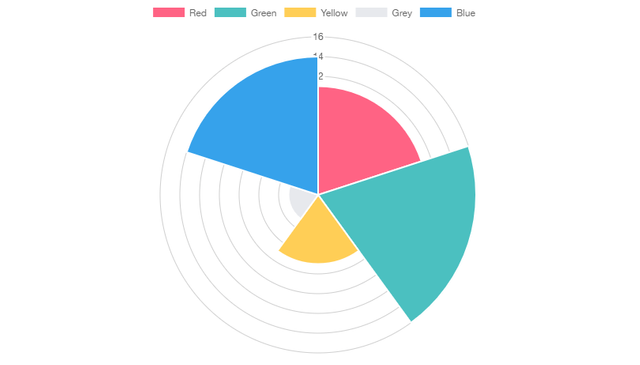
- Tipe 6 blue charts
Tutorial Contents
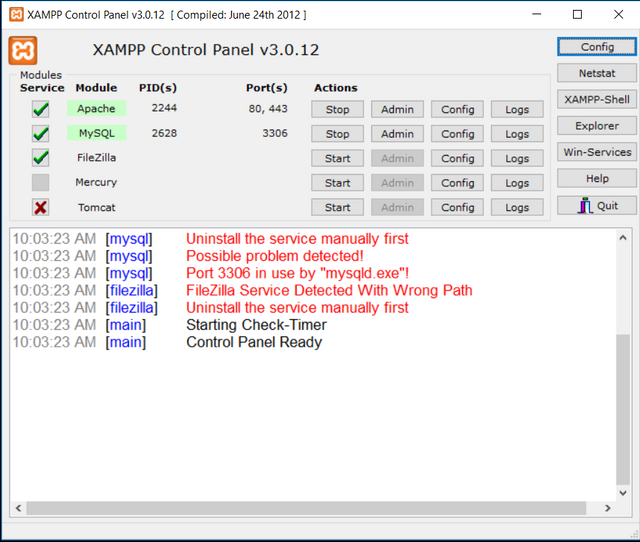
First make sure your Xampp app is already run apache and mysql.
After that create a folder with any name and save that folder in C: \ xampp \ htdocs and then create the index.php file in your folder earlier.
Now we will take the ChartJS library, which can be done in the first two ways is to download ChartJS here .
Then extra file Chart.js.zip Into your htdocs I'm here using C: \ xampp \ htdocs \ graph.
Then open the index.php file that you created earlier and write this script:
"< html>
< head>
< title>Learn Make Graphic with PHP< /title>
< script src="Chart.bundle.js">< /script>
< style type="text/css">
.container {
width: 50%;
margin: 15px auto;
}
< /style>
< /head>
< body>
< div class="container">
< canvas id="myChart" width="100" height="100">< /canvas>
< /div>
< script>
var ctx = document.getElementById("myChart");
var myChart = new Chart(ctx, {
type: 'bar',
data: {
labels: ["Red", "Blue", "Yellow", "Green", "Purple", "Orange"],
datasets: [{
label: '# of Votes',
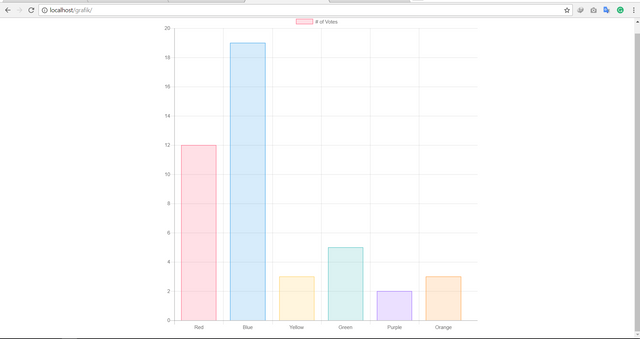
data: [12, 19, 3, 5, 2, 3],
backgroundColor: [
'rgba(255, 99, 132, 0.2)',
'rgba(54, 162, 235, 0.2)',
'rgba(255, 206, 86, 0.2)',
'rgba(75, 192, 192, 0.2)',
'rgba(153, 102, 255, 0.2)',
'rgba(255, 159, 64, 0.2)'
],
borderColor: [
'rgba(255,99,132,1)',
'rgba(54, 162, 235, 1)',
'rgba(255, 206, 86, 1)',
'rgba(75, 192, 192, 1)',
'rgba(153, 102, 255, 1)',
'rgba(255, 159, 64, 1)'
],
borderWidth: 1
}]
},
options: {
scales: {
yAxes: [{
ticks: {
beginAtZero: true
}
}]
}
}
});
< /script>
< /body>
< /html> "
- The above is the first way we now discuss the second bit way, the second way we can use the CDN so that we do not need to download the library ChartJS manually, it is certainly easier and its performance so much faster. so its implementation you can change the script index.php on line 4 to be like this:
"< script src="https://cdnjs.cloudflare.com/ajax/libs/Chart.js/2.3.0/Chart.bundle.js">< /script>"
- If you have finished all the next step we test the results by the way we type in our browser Url http: // localhost / graph / , and see the results would be like this:
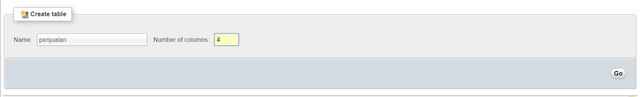
- then prepare the Database with the name "exercise" after that uatlah table with the name "sales" with size "4 colom s" like this:
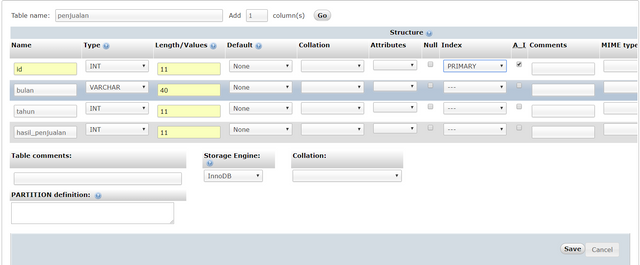
- If it's done it will come out like this and fill in a word like this:
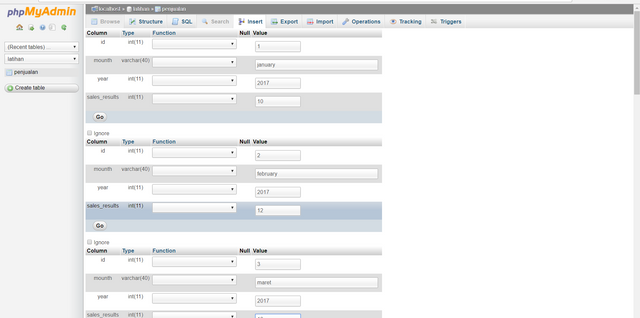
- If the tablenya is done now we just need to mengimputkan data into the table. Like this:
- For more convenience please copy sql below and run:
'
INSERT INTO `penjualan` VALUES (1,'January',2016,10);
INSERT INTO `penjualan` VALUES (2,'February',2016,12);
INSERT INTO `penjualan` VALUES (3,'Maret',2016,13);
INSERT INTO `penjualan` VALUES (4,'April',2016,18);
INSERT INTO `penjualan` VALUES (5,'May',2017,16);
INSERT INTO `penjualan` VALUES (6,'Juni',2016,14);
INSERT INTO `penjualan` VALUES (7,'July',2016,15);
INSERT INTO `penjualan` VALUES (8,'Agustus',2016,12);
INSERT INTO `penjualan` VALUES (9,'September',2016,19);
INSERT INTO `penjualan` VALUES (10,'Oktober',2016,12);
INSERT INTO `penjualan` VALUES (11,'November',2016,12);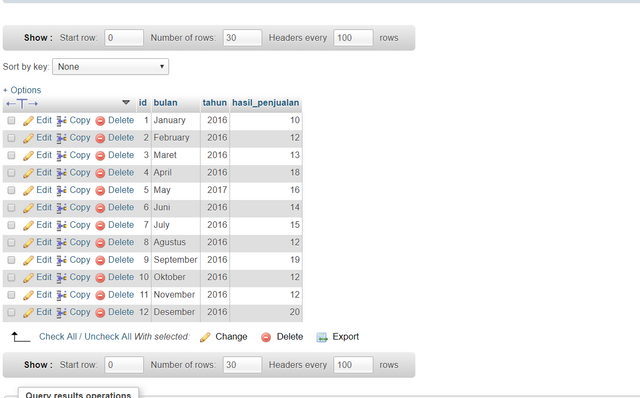
INSERT INTO `penjualan` VALUES (12,'Desember',2016,20); '- Once the data is input then it will look like this:
- Now we just need to modify the index.php earlier in order to connect to the database to see the graph from the sales table, and edit it like this:
< ?php
$koneksi = mysqli_connect("localhost", "root", "", "latihan");
$bulan = mysqli_query($koneksi, "SELECT bulan FROM penjualan WHERE tahun='2016' order by id asc");
$penghasilan = mysqli_query($koneksi, "SELECT hasil_penjualan FROM penjualan WHERE tahun='2016' order by id asc");
? >
< html>
< head>
< title>Learn Make Graphic with PHP< /title>
< script src="Chart.bundle.js">< /script>
    < style type="text/css">
        .container {
            width: 50%;
            margin: 15px auto;
        }
    < /style>
< /head>
< body>
    < div class="container">
        < canvas id="myChart" width="100" height="100">< /canvas>
    < /div>
    < script>
        var ctx = document.getElementById("myChart");
        var myChart = new Chart(ctx, {
            type: 'bar',
            data: {
                labels: [< ?php while ($b = mysqli_fetch_array($bulan)) { echo '"' . $b['bulan'] . '",';}?>],
                datasets: [{
                        label: '# of Votes',
                        data: [< ?php while ($p = mysqli_fetch_array($penghasilan)) { echo '"' . $p['hasil_penjualan'] . '",';}?>],
                        backgroundColor: [
                            'rgba(255, 99, 132, 0.2)',
                            'rgba(54, 162, 235, 0.2)',
                            'rgba(255, 206, 86, 0.2)',
                            'rgba(75, 192, 192, 0.2)',
                            'rgba(153, 102, 255, 0.2)',
                            'rgba(255, 159, 64, 0.2)',
                            'rgba(255, 99, 132, 0.2)',
                            'rgba(54, 162, 235, 0.2)',
                            'rgba(255, 206, 86, 0.2)',
                            'rgba(75, 192, 192, 0.2)',
                            'rgba(153, 102, 255, 0.2)',
                            'rgba(255, 159, 64, 0.2)'
                        ],
                        borderColor: [
                            'rgba(255,99,132,1)',
                            'rgba(54, 162, 235, 1)',
                            'rgba(255, 206, 86, 1)',
                            'rgba(75, 192, 192, 1)',
                            'rgba(153, 102, 255, 1)',
                            'rgba(255, 159, 64, 1)',
                            'rgba(255, 99, 132, 0.2)',
                            'rgba(54, 162, 235, 0.2)',
                            'rgba(255, 206, 86, 0.2)',
                            'rgba(75, 192, 192, 0.2)',
                            'rgba(153, 102, 255, 0.2)',
                            'rgba(255, 159, 64, 0.2)'
                        ],
                        borderWidth: 1
                    }]
            },
            options: {
                scales: {
                    yAxes: [{
                            ticks: {
                                beginAtZero: true
                            }
                        }]
                }
            }
        } );
    < /script>
< /body> < /html> '
- Once done in edit and try running will come out like this:
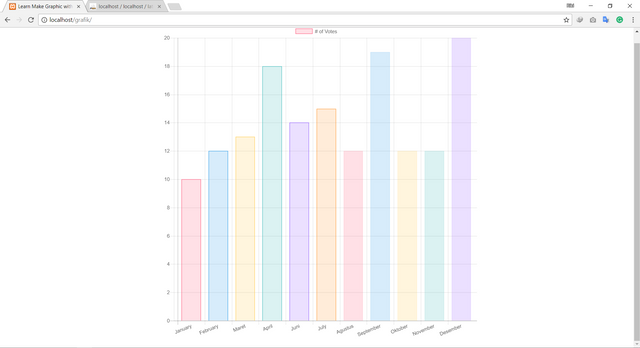
- And the chart of the sales table is done.
Curriculum
Posted on Utopian.io - Rewarding Open Source Contributors
Thank you for the contribution. It has been approved.
You can contact us on Discord.
[utopian-moderator]
Hey @creon, I just gave you a tip for your hard work on moderation. Upvote this comment to support the utopian moderators and increase your future rewards!
Hey @rajamalikulfajar I am @utopian-io. I have just upvoted you!
Achievements
Community-Driven Witness!
I am the first and only Steem Community-Driven Witness. Participate on Discord. Lets GROW TOGETHER!
Up-vote this comment to grow my power and help Open Source contributions like this one. Want to chat? Join me on Discord https://discord.gg/Pc8HG9x