Search for marine subspecies in a sea of tokens
Link to the github repository
https://github.com/steemit/steem
After a few weeks very busy with my students, I can finally publish my third contribution in the analysis category.
1. INTRODUCTION
The typical classification of accounts in Steem/Steemit using the analogy with marine mammals and other species (whales, orcas, dolphins, minnows and plankton) always seemed interesting to me because of my passion for biology.
In this analysis I try to do a refinement in this classification by searching and classifying different subspecies within each group.
For this I will use the amounts and percentages of all the tokens that an account can have besides the VESTS (SP), that is, STEEM and SBD.
This will allow me to classify subgroups within each group and calculate some statistics of these subgroups (arithmetic means and typical deviations) that I wanted to represent using the concept of BIOLOGICAL DIVERSITY and trying to translate the results into graphs and figures that are easily understandable.
2. ANALYSIS
2.1 RAW DATA
- DB SteemSQL – Steem SQL Database
- DB Table: Accounts
- Date when submitting this analysis: 26.06.2018
- Tool: KNIME Analytics Platform
Query(06.06.2018):
SELECT
Accounts.name,
Accounts.vesting_shares,
Accounts.sbd_balance,
Accounts.balance
FROM Accounts
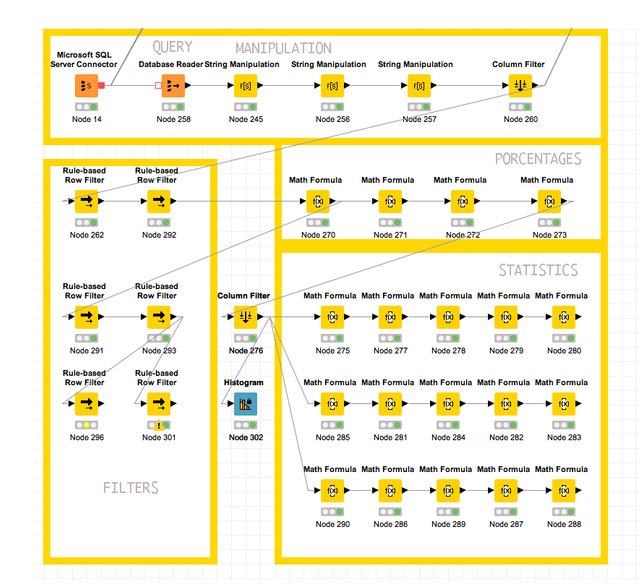
I have connected with the Steem database, made the query, manipulated, filtered and processed the data using the KNIME Analytics Platform with the Work-Flow represented in the following figure.
KNIME Work-Flow
2.2 TYPICAL CLASSIFICATION OF ACCOUNTS
The grouping of accounts in each species has been made using the following values, which represent the amount of Mvests that each account has valued in STEEM POWER (SP).
- Plankton 0 - 500 SP
- Minnow 500 - 5,000 SP
- Dolphin 5,000 - 50,000 SP
- Orca 50,000 - 500,000 SP
- Whale 500,000+ SP
ABSOLUTE AND RELATIVE VALUES
| SPECIES | TOTAL | % |
|---|---|---|
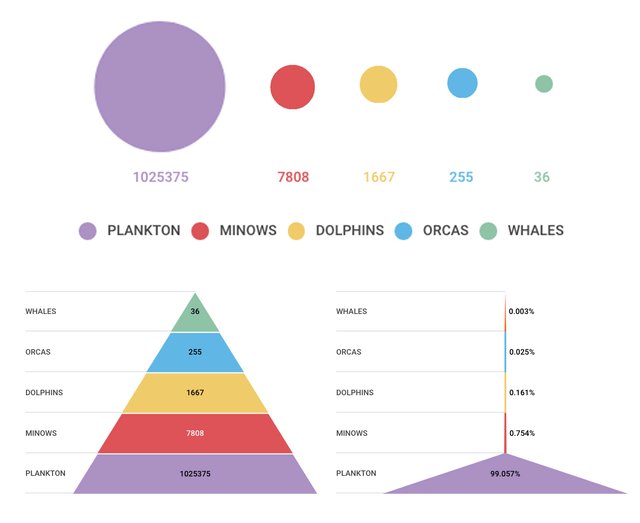
| PLANKTON | 1,025,375 | 99.057% |
| MINOWS | 7,808 | 0.754% |
| DOLPHINS | 1,667 | 0.161% |
| ORCAS | 255 | 0.025% |
| WHALES | 36 | 0.003% |
| ALL | 1,035,121 | 100% |
I have used three different graphs to represent the same information to emphasize the order and proportions of specimens in each group or species since their populations are very different.
Evolution over time of populations
The first thing I wanted to analyze is the evolution over time of these values, for this I used the information from a previous analysis of February 2018 made by @arcange Steemit Statistics – 2018.02.26 where the following data was obtained
| Populations in February 2018 | TOTAL | % |
|---|---|---|
| PLANKTON | 766,699 | 98.840% |
| MINNOWS | 7,244 | 0.933% |
| DOLPHINS | 1,469 | 0.189% |
| ORCAS | 247 | 0.031% |
| WHALES | 36 | 0.004% |
| ALL | 604,938 | 100% |
The total increase in accounts in about three months was 25,9426 which represents an increase of 33.44%. The values of the population increases for each species are shown in the following table.
| SPECIES | ABS DIF | % DIF | % VARIATION IN THE ECOSYSTEM |
|---|---|---|---|
| PLANKTON | +258676 | +33.74% | 0.21673%% |
| MINOWS | +564 | +7.79% | -0.17987% |
| DOLPHINS | +198 | +13.48%% | -0.02838% |
| ORCAS | +8 | +3.24% | -0.00684% |
| WHALES | +0 | +0.00% | -0.00164% |
The population of the plankton is the one that grew the most in percentage +33.74%, followed by the dolphins +13.48%, the minnows +7.79% and Orcas +3.24%. The number of whales has not increased in recent months.
It seems that the food chain of the species follows a natural process where small species increase their populations more quickly, with the exception of dolphins that have grown more in proportion than the minnows (or perhaps the minnows have grown less than as expected by his position in the food pyramid)
Regarding the percentage of contribution that each species has in the total ecosystem, the plankton has been the only species that has increased its contribution in + 0.21673%, while the rest has decreased, although in small percentages, the most relevant being the one related to the minnows - 0.17987%
The balance between species in the ecosystem remains very stable. The only variability seems to be in the minnow species because perhaps some specimens are mutating to be dolphins and/or because less plankton becomes minnow, although this variability is in a certain way also a natural process.
2.3. SEARCH FOR MARINE SUBSPECIES IN A SEA OF TOKENS
2.3.1. WHALES
POPULATION: 36
WHALES TOKENS RESOURCES
| TOKEN | RESOURCES | % of the total |
|---|---|---|
| SP | 117,324,965 | 61.57% |
| STEEM | 2,601,724 | 3.83% |
| SBD | 914,540 | 6.33% |
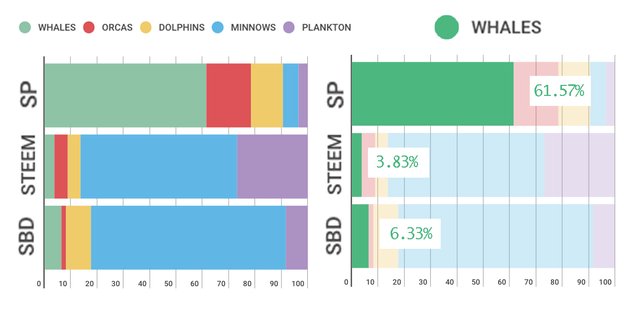
The whales own 61.57% of the STEEM POWER of the ecosystem and taking into account that there are only 36 gives an idea of how much decision power they handle, which is also related to a great risk.
On the other hand, their resources in STEEM 3.83% and SBD 6.33% are relatively low, which shows that they prefer to have their resources concentrated in STEEM POWER and shows, in theory, a great commitment to the proper functioning of the ecosystem and its future existence.
WHALES SUBSPECIES
The resources of an account are not only VESTS (SP), but also the amount of STEEM and SBD (which can be converted into VESTS). This allows to divide each species into several subspecies. Then I will use the number of tokens in STEEM and SBD to characterize each species in more detail to study, so to speak, the diversity in that species.
STATISTICS OF WHALES BY TOKENS PROPORTIONS
| VESTS(SP) | STEEM | SBD | |
|---|---|---|---|
| MIN. | 69% | 0% | 0% |
| MAX. | 100% | 30% | 10.36% |
| MEAN | 97.65% | 2.261% | 0.674% |
| STD-DEV | 6.212% | 6.007% | 2.281% |
COLORED SUBSPECIES OF THE WHALES
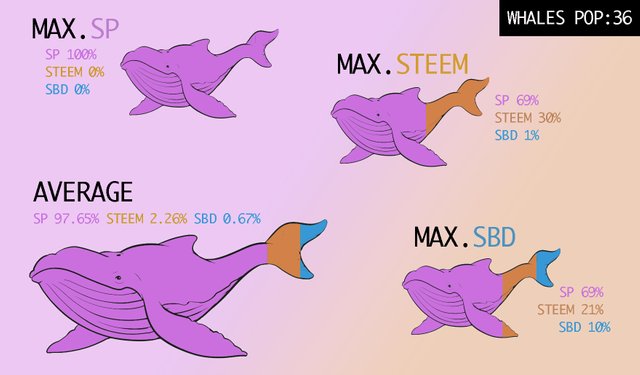
NOTE:
I used this kind of naif graphic to show in a simple way some representatives of the group that we could call subspecies where the colors show the proportions they have in the different tokens. In addition to the average representative, representatives MAX.-SP, MAX. STEEM, MAX. SBD show those configurations where the value of each token is maximum.
It is appreciated how all the whales are mainly purple, that is, they have a large proportion of SP (minimum of 69% and maximum of 100%). Some whales also have orange stripes (STEEM) and blue stripes (SBD).
2.3.2. ORCAS
POPULATION: 255
ORCAS TOKENS RESOURCES
| TOKEN | RESOURCES | % of the total |
|---|---|---|
| SP | 32286483 | 16.94% |
| STEEM | 260836 | 1.81% |
| SBD | 3404771 | 5.02% |
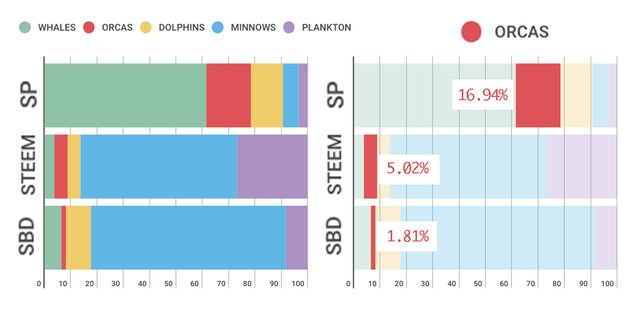
The Orcas possess 16.95% of the total SP, being the second group have more SP. Its resources in STEEM 5.02% and SBD 1.81% seem to indicate that they have preference for STEEM (instead of SBD) which could be interpreted as a desire to become whales.
ORCAS SUBSPECIES
STATISTICS OF THE ORCAS BY TOKENS PROPORTIONS
| VESTS(SP) | STEEM | SBD | |
|---|---|---|---|
| MIN. | 4.05% | 0% | 0% |
| MAX. | 100% | 95.68% | 23.99% |
| MEAN | 96.55 | 2.26% | 0.82% |
| STD-DEV | 10.47% | 10.17% | 2.38% |
COLORED SUBSPECIES OF THE ORCAS
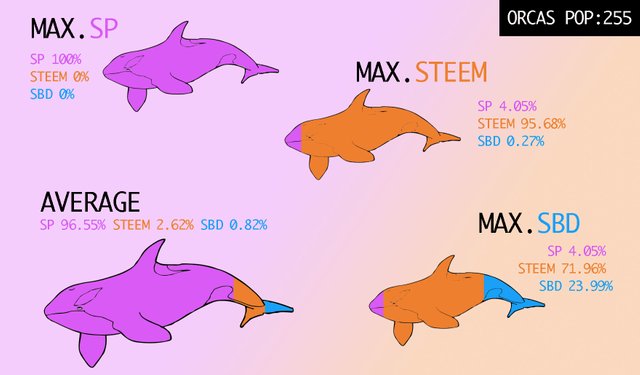
Although the average specimen of the orcas is mostly purple-SP and some are 100% purple-SP, other specimens reduce this proportion down to 4% as they have higher proportions of Orange-STEEM (up to 95%) and Blue-SBD (up to a maximum of 24%)
2.3.3. DOLPHINS
POPULATION: 1,647
DOLPHINS TOKENS RESOURCES
| TOKEN | RESOURCES | % of the total |
|---|---|---|
| SP | 22763424 | 11.95% |
| STEEM | 3292534 | 4.85% |
| SBD | 1378552 | 9.54% |
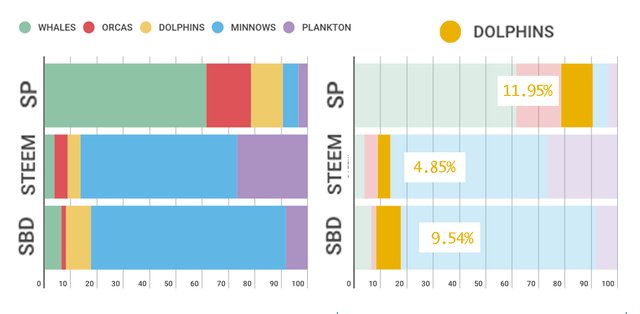
Dolphins possess 11.95% of the total SP, being the third species in this sense.Its resources in STEEM 4.85% and SBD 9.54% seem to indicate that they have preference for SBD as opposed to the orcas.
DOLPHINS SUBSPECIES
STATISTICS OF THE DOLPHINS BY TOKENS PROPORTIONS
| VESTS(SP) | STEEM | SBD | |
|---|---|---|---|
| MIN. | 4.05% | 0% | 0% |
| MAX. | 100% | 95.68% | 23.99% |
| MEAN | 96.553 | 2.261% | 0.822% |
| STD-DEV | 10.477% | 10.17% | 2.38% |
COLORED SUBSPECIES OF THE DOLPHINS
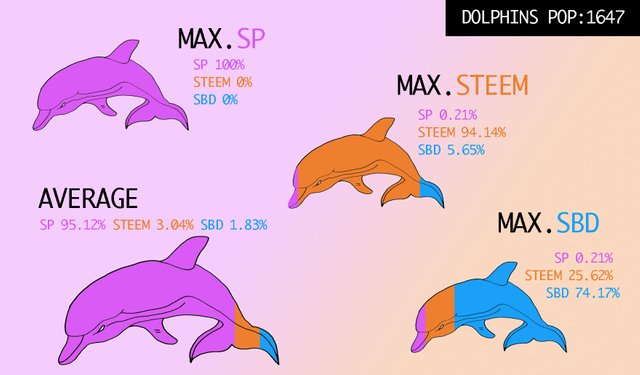
The dolphins have a structure similar to the Orcas although there are specimens that have greater proportions of blue stripes or SDB (up to 74%) which indicates their greater preference for liquidity and risk control than whales and orcas.
2.3.4. MINOWS
POPULATION: 7,808
MINOWS TOKENS RESOURCES
| TOKEN | RESOURCES | % of the total |
|---|---|---|
| SP | 11519809 | 6.05% |
| STEEM | 40330466 | 59.42% |
| SBD | 10691596 | 74.00% |
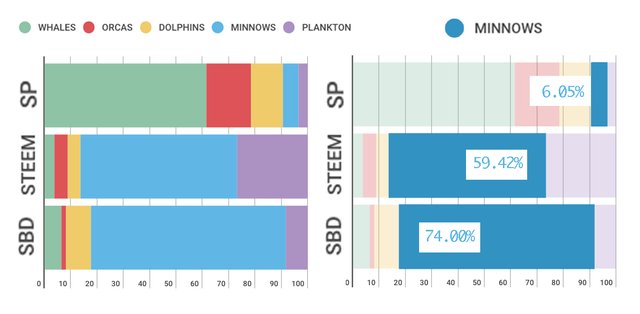
In this species there are important differences with respect to the previous ones.
Minnows possess the highest proportions of STEEM 59.42% and especially of SBD 74.00% being only a population of 7,808 accounts which imply that they are very active in obtaining rewards in SBD through the creation of posts. It seems that they prefer, as a group, not to convert their large STEEM resources into SP.
MINOWS SUBSPECIES
STATISTICS OF THE MINOWS BY TOKENS PROPORTIONS
| VESTS(SP) | STEEM | SBD | |
|---|---|---|---|
| MIN. | 0% | 0% | 0% |
| MAX. | 100% | 99.93% | 83.46% |
| MEAN | 92.45% | 3.67% | 3.81% |
| STD-DEV | 14.53% | 11.45% | 8.91% |
COLORED SUBSPECIES OF THE MINNOWS
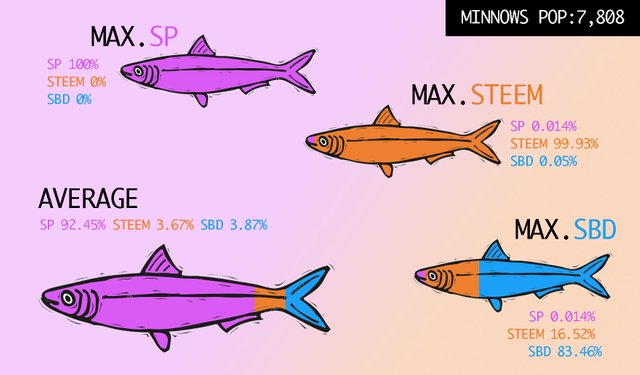
The average specimen continues being similar in token proportions to the previous ones although it continues increasing the proportions of STEEM 99% and SBD 83% for some specimens of the group.
2.3.5. PLANKTON
POPULATION: 1025375
PLANKTON TOKENS RESOURCES
| TOKEN | RESOURCES | % of the total |
|---|---|---|
| SP | 6,648,826 | 3.49% |
| STEEM | 18,244,661 | 26.88% |
| SBD | 1,203,456 | 8.33% |
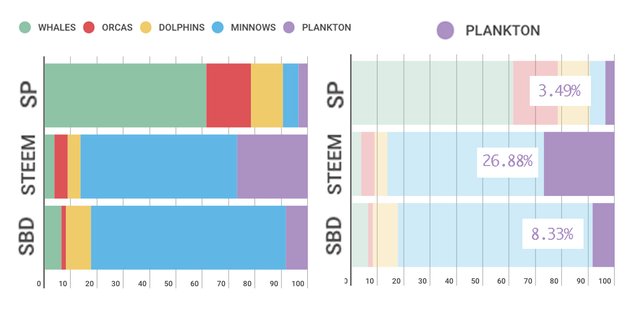
This species is characterized primarily by its large population of 1,025,375 accounts which represents 99,057% of the total and for this reason it is suggestive to make a special analysis for this species found below.
The plankton stands out in the possession of 26.88% of the STEEM but it is a bit misleading because this relatively large amount, as we will see later, is contributed by a few accounts related to exchanges.
PLANKTON SUBSPECIES
STATISTICS OF THE PLANKTON BY TOKENS PROPORTIONS
| VESTS(SP) | STEEM | SBD | |
|---|---|---|---|
| MIN. | 0% | 0% | 0% |
| MAX. | 100% | 100% | 100% |
| MEAN | 94.38% | 1.86% | 3.74% |
| STD-DEV | 17.82% | 11.76% | 13.34% |
COLORED SUBSPECIES OF PLANKTON
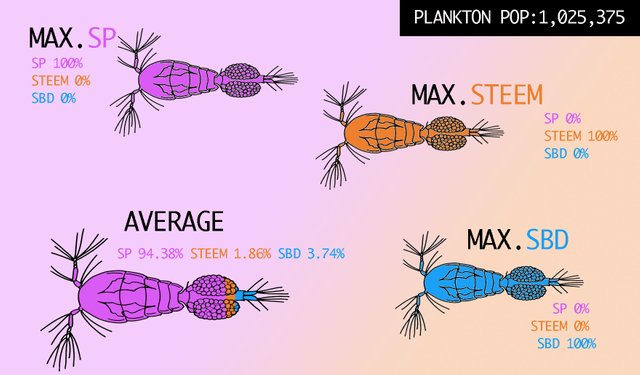
Specimens that have only one color appear in this species, that is, they only have one type of token. The average specimen continues to have proportions of tokens similar to the previous species.
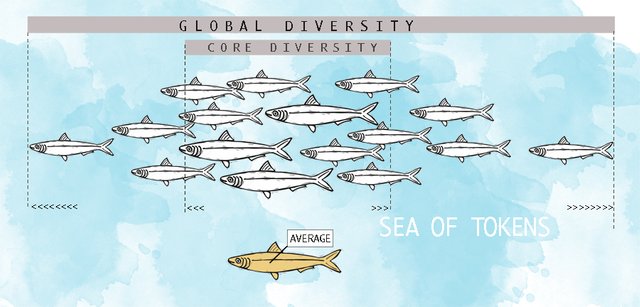
2.4.6 COMPARATIVE AVERAGES AND DIVERSITY BY TOKENS
Some definitions of concepts.
From the previous statistics I have defined the following concepts:
AVERAGE SPECIMEN = ARITHMETIC MEAN
It shows a characteristic value of the group.GLOBAL DIVERSITY = MAX - MIN
Gives an idea of the diversity of the whole group.CORE DIVERTITY = STD-DEV (standard deviation)
It gives an idea of the diversity of the main nucleus or CORE of the group close to the average value.
| WHALES | SP | STEEM | SBD |
|---|---|---|---|
| Average | 97.65% | 2.26% | 0.67% |
| Global Diversity | 31% | 30% | 10.36% |
| Core Diversity | 6.21% | 6.017% | 2.28% |
| ORCAS | SP | STEEM | SBD |
|---|---|---|---|
| Average | 96.55% | 2.62% | 0.82% |
| Global Diversity | 95.95% | 95.68% | 23.99% |
| Core Diversity | 10.47% | 10.17% | 2.38% |
| DOLPHINS | SP | STEEM | SBD |
|---|---|---|---|
| Average | 95.12% | 3.04% | 0.82% |
| Global Diversity | 99.78% | 94.14% | 23.99% |
| Core Diversity | 11.24% | 9.89% | 5.40% |
| MINOWS | SP | STEEM | SBD |
|---|---|---|---|
| Average | 92.45% | 3.67% | 3.87% |
| Global Diversity | 99.98% | 99.93% | 83.46% |
| Core Diversity | 14.53% | 11.45% | 8.91% |
| PLANKTON | SP | STEEM | SBD |
|---|---|---|---|
| Average | 94.38% | 1.86% | 3.74% |
| Global Diversity | 100% | 100% | 100% |
| Core Diversity | 17.82% | 11.76% | 13.34% |
To visually interpret the data from the previous tables I created these graphs.
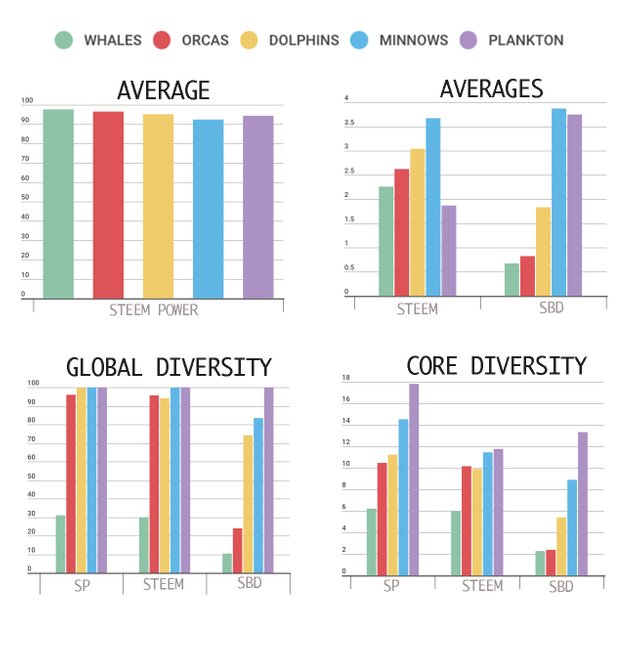
AVERAGE SPECIMENS
[SP] In regard to the average specimen that characterizes each species relative to the proportion of SP, all of them have similar values that are above 92%.
[STEEM] STEEM's percentage grows as the size of the species increases except for the plankton that has the lowest proportion of STEEM.
[SBD] In this case the minnows and plankton have the highest percentages above 3.5% and whales and Orcas have the least.
GLOBAL DIVERSITY
The whales have the lowest global diversities in the three tokens below 30% and all the others have global diversities above 70% reaching 100% with the exception of the orcas with respect to SBD that does not exceed 25%.
CORE DIVERSITY
This is where the columns of the graphs appear more staggered in the three tokens, being in SP where there is greater variety between the species and the SBD where the core diversity is lower
CONCLUDING
With respect to the average specimens, we can say that in all the species they are colored in a very similar way and mainly purple because of their greater proportion of SP. When decreasing the size of the specimens of the species (Whales> Orcas> Dolphins> Minnows> Plankton) it increases the proportions of the colors orange (STEEM) and blue (SBD)
We can say that whales are those that "like to swim more closely or their colors are less varied", that is, their "global and core diversities" (in type of tokens) are smaller. And the plankton, followed by minnows, "likes to swim more separated or have a wider variety of colors among their specimens" because their global and core diversities of token proportions are greater.
In this way, it seems that the metaphor of the use of a marine ecosystem with different species maintains a very adequate parallelism with biology since the groups with some dozen of specimens of real whales travel relatively together and a group of thousands of minnows move occupying very large distances relatively to their size.
2.4.7 SOME PLANKTON SURPRISES
As indicated above, plankton is a species with many accounts and requires a more detailed view since there is great heterogeneity.
An account that is in this category is because it does not have enough SP to be in another superior species, but I have considered converting its STEEM and SBD resources into VESTS (SP).
Creating a variable that adds the three types of tokens TOKENS_SUM = VEST (SP) + STEEM + SBD to re-classify the plankton obtaining new groups that I have called pseudo-whales, pseudo-orcas, pseudo-dolphins, pseudo-minows and pseudo-plankton (or genuine plankton).
The quantities of specimens for each pseudo-species are indicated in the following figure.
PSEUDO FAUNA
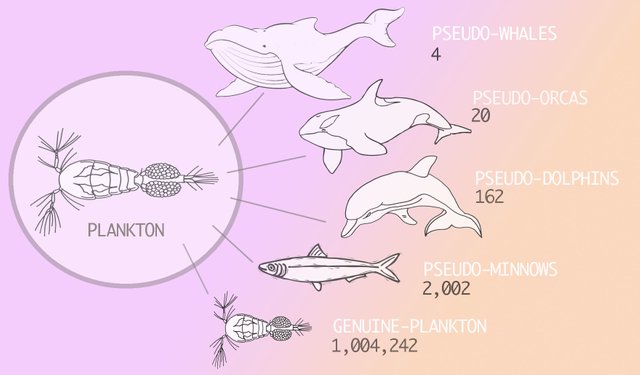
The proportions of members in each of these pseudo species have a proportion similar to that previously explained.
The reasons why these accounts do not convert their STEEM and/or SBD resources into VEST(SP) are certainly varied.
Looking at some of these accounts that I have added in the following table it is observed that some of them are exchange accounts and therefore their mission is to negotiate, convert or transfer tokens and not have decision power in the ecosystem.
The Pseudo-Whales and some Pseudo-Orcas
| Account | SP | SBD | STEEM |
|---|---|---|---|
| ben | 0.32 | 0.93 | 2213971 |
| binance-hot | 0.50 | 3.67 | 6341798 |
| openledger-dex | 0.51 | 36581 | 561192 |
| bithumb.hot | 0.10 | 0.00 | 1217601 |
| alpha | 40.32 | 5773 | 131276 |
| aton | 26.96 | 0.00 | 100000 |
| bytemaster | 0.00 | 0.01 | 139184 |
| dantheman | 104 | 98 | 300198 |
| dele-puppy | 0.00 | 0.02 | 222934 |
| hitbtc-exchange | 5.78 | 1222 | 155735 |
| muchfun | 6.07 | 0.10 | 415000 |
Hi @sintoniz, that's an impressive work and an enjoyable read with the biology analogies :) However, a few remarks:
The contribution from @ghulammujtaba summarized the state of all accounts that were created between Jan 2017 and Feb 2018. You're looking into all accounts as of now including those created before Jan 2017. I could imagine that at least some whales existed before that data. So I think the relative growth numbers are not fully correct in this case.
I haven't seen the distribution of the STEEM/SBD in the VESTS classification before. If I had to guess, I'd probably came up with another distribution, with less assets with plankton and minnows. You've already pointed out that some of these are exchanges. Some Steemit accounts may fall in this category as well. And it's also quite common to keep some funds in inactive/rep-25/low-SP accounts. Nevertheless, these accounts fall into the according categories based on their VESTs, so the result is correct.
Great visualizations!!
Your contribution has been evaluated according to Utopian policies and guidelines, as well as a predefined set of questions pertaining to the category.
To view those questions and the relevant answers related to your post, click here.
Need help? Write a ticket on https://support.utopian.io/.
Chat with us on Discord.
[utopian-moderator]
hi @crokkon,
You're right, I got confused with the data from the contribution from @ghulammujtaba which I took as accumulated data instead of results created between Jan 2017 and Feb 2018.
I have updated the data, analysis and conclusions for the section of variations of the populations of each species using data from a post from @arcange Steemit Statistics – 2018.02.26
In this post "Inactive" and "Red Fish" levels are used, which I have converted into plankton to maintain consistency with the rest of the analysis.
Thank you
Hey @sintoniz
Thanks for contributing on Utopian.
We’re already looking forward to your next contribution!
Want to chat? Join us on Discord https://discord.gg/h52nFrV.
Vote for Utopian Witness!