USING PYTHON AND matplotlib ADD A SECOND GRAPH TO A UI WINDOW: a task request for the open-source project The Amanuensis: Automated Songwriting and Recording
Repository
https://github.com/to-the-sun/amanuensis
The Amanuensis is an automated songwriting and recording system aimed at ridding the process of anything left-brained, so one need never leave a creative, spontaneous and improvisational state of mind, from the inception of the song until its final master. The program will construct a cohesive song structure, using the best of what you give it, looping around you and growing in real-time as you play. All you have to do is jam and fully written songs will flow out behind you wherever you go.
If you want to try it out, please get a hold of me! Playtesters wanted!
Details
After the highly successful implementation of a graph visualizing the real-time rhythm being calculated by consciousness.py, I would like to take a step further and add another graph to that same UI window. This will be even more informational and will allow for increased understanding of what's going on under the hood, useful for diagnostics and the casual user alike.
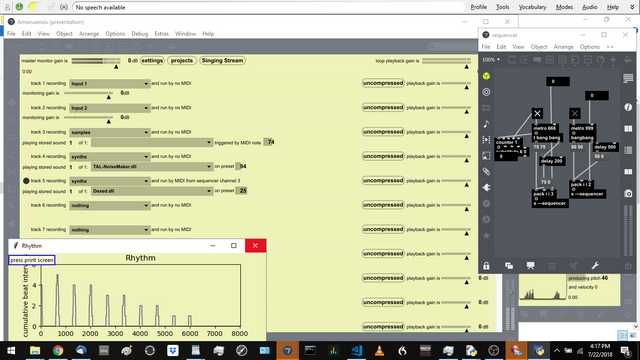
the Rhythm graph can be seen in the bottom left
The graph I have in mind would essentially be a zoomed in view of the very beginning of the Rhythm graph. It will be a graph of what's happening each time a player hits a note; being that the Rhythm graph is basically a prediction of where the beats will lie in the upcoming handful of seconds, the very beginning of it represents the present moment.
This is the critical calculation made in consciousness.py: determining the likelihood variable of the user's input note, essentially whether it is a hit or a miss. If the user's input coincides with a peak in the Rhythm graph, it is considered a hit, otherwise it's a miss. As The Amanuensis evolves more and more towards a Guitar Hero-like game, I also see this window displaying "score" information to the player for each note they play; the higher the peak, the higher the score, for example.
Components
Specifically, the data to be graphed will be the range denoted by line 243 in consciousness.py:
for ms in range(home, spout[0] + atom + 1):
and should be drawn either directly before or after that for statement.
The X values in that range are keys to the rhythmdictionary. They are millisecond timestamps and will need to have spout[0](the timestamp of the user's played note) subtracted from them, same as the Rhythm graph. Although it can change, this will give you a domain of something like -20 through 20, straddled across 0, which is the present moment.
If a number in that range doesn't exist as a key in rhythm, the Y value associated with it will need to be considered 0, same as with the Rhythm graph. def dense exists to be called for this purpose.
The Y values will be the integers associated with each key in rhythmand will probably be roughly somewhere between 0 and 20. The Y value range could mimic the Rhythm graph's range exactly, but in the interest of making this graph as "zoomed in" as possible, ideally it would change dynamically to show only the span of the lowest to highest numbers being graphed at any moment. A buffer space of one on the top and bottom of this range might look best. So for example if the Y values are all between 11 and 14, the range of the graph would change to display 10 through 15 upon that drawing; if the next moment they are all between 12 and 16, the range would change to display 11 through 17.
This graph should be a square and should be placed directly to the left of the Rhythm graph. It can be just as tall as the Rhythm graph and does not need to display an X- or Y-axis label.
One other essential note: currently def remove_past_moments removes any keys that are less than zero after subtracting spout[0]. In reality this removes some essential information and will need to be modified. As far as this new graph goes, half of it will always lie less than zero, so past moments should not be considered irrelevant and removed until they actually are less than -(atom * 2) after subtracting spout[0]. Ideally though, the Rhythm graph would still only display X values of zero or greater.
Deadline
For the right person, I imagine this task would take no more than 14 days.
Communication
Reply to this post or contact me through Github for more details. I can also be found on discord @to_the_sun.
Thanks for the task request, @to-the-sun!
Your contribution has been evaluated according to Utopian policies and guidelines, as well as a predefined set of questions pertaining to the category.
To view those questions and the relevant answers related to your post, click here.
Need help? Write a ticket on https://support.utopian.io/.
Chat with us on Discord.
[utopian-moderator]
Is this task still open? I'd be happy to help.
@gustavelebon, Couldn't find someone to take it originally, but I've since decided to go in another direction anyway. So in a sense it is still open, but you'd need to work with Javascript instead. If you're still interested, let me know. I'd have to fill you in on an entirely different angle I'm taking with this UI stuff.
Ok, I am new to steemit, I like your app and looking into possibilities to earn some money with it. I work with Javascript too, so no problem there.
@gustavelebon, yeah Steemit is great, especially Utopian. The payouts are really good for New Feature posts like this.
So to avoid latency, I needed to internalize the external Python script I was using and that's why the task has changed. The app is written in Max/MSP which can use JavaScript natively via the
jsuiobject. I can provide you with the right variables and help you connect it up to the rest of the app, but you would be responsible for recreating a "graph" (something like the mockup below) using theSketchobject (OpenGL). There's also something called mgraphics, which would probably work as well. Are you familiar/willing to look into either of those?Also, do you have a discord? It would probably be easiest to communicate there.
I'll have a look. Find me on Discord: gustavelebon#8927
Hey @to-the-sun
Thanks for contributing on Utopian.
We’re already looking forward to your next task request!
Want to chat? Join us on Discord https://discord.gg/h52nFrV.
Vote for Utopian Witness!