SHORT GBPUSD 4HR - 500 Pips of Selling Opportunity
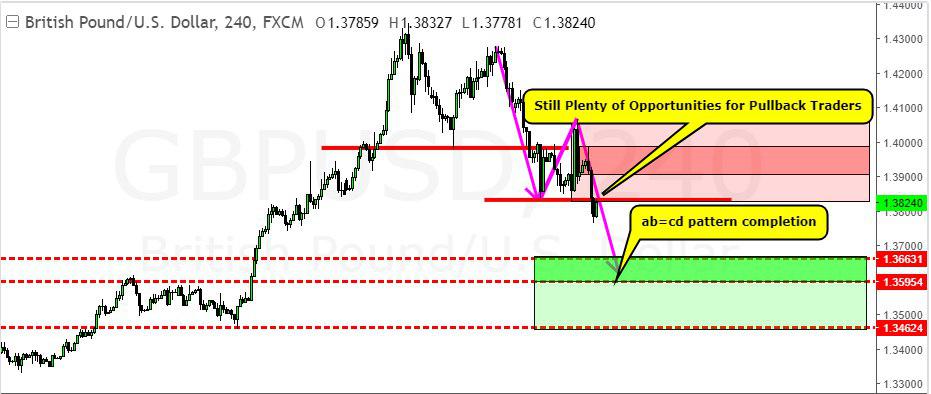
On the chart above you'll notice a few multi-color boxes. The lighter red box represents the technical zone in which price can retrace too before invalidating the current bearish move, while the darker zone would be the ideal entry area for a longer term trader. Obviously for a day trader you can look for opportunities at a much lower level and with much more frequency.
The green boxes represent where I think price can go to before we start to experience more buying pressure. The lighter green box is the bigger zone, while the darker green box represents the first area of major structure on the higher timeframe.
If you like the idea and write up. Please do me a favor and hit that "UPVOTE" and/or Leave a comment. It only takes a second or so Thanks.
MUST READ!!!
Disclosure: Please be informed that information we provide is NOT a trading recommendation or investment advice. All our work is for educational purposes only.

Right click then open in new tab to zoom in
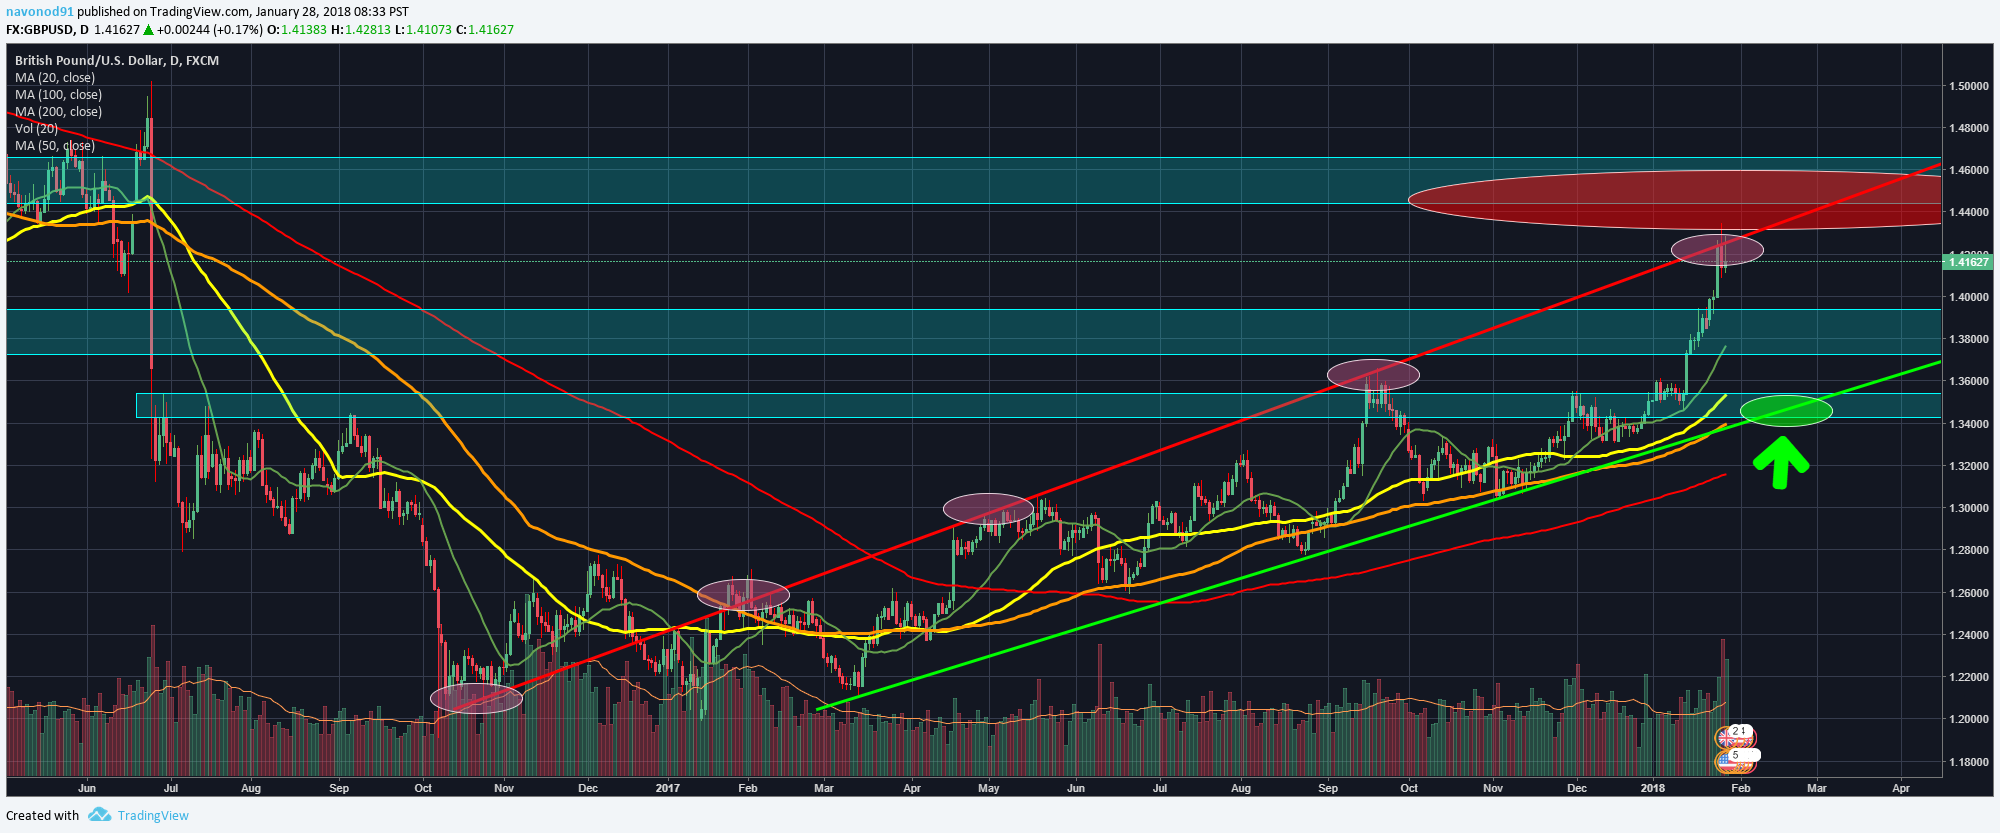
My January 28 Post
Today
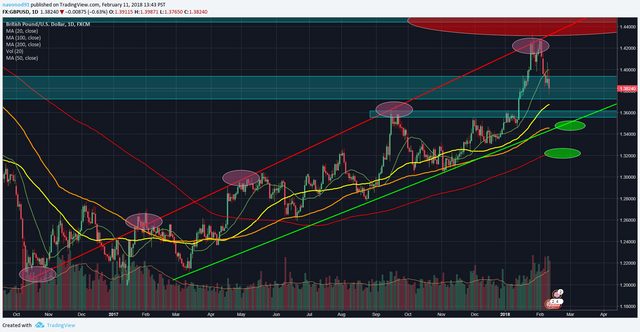
It is trading about 300 pips lower from my sell area from two weeks ago. I agree with your buy price. It coincides pretty well with my analysis.